

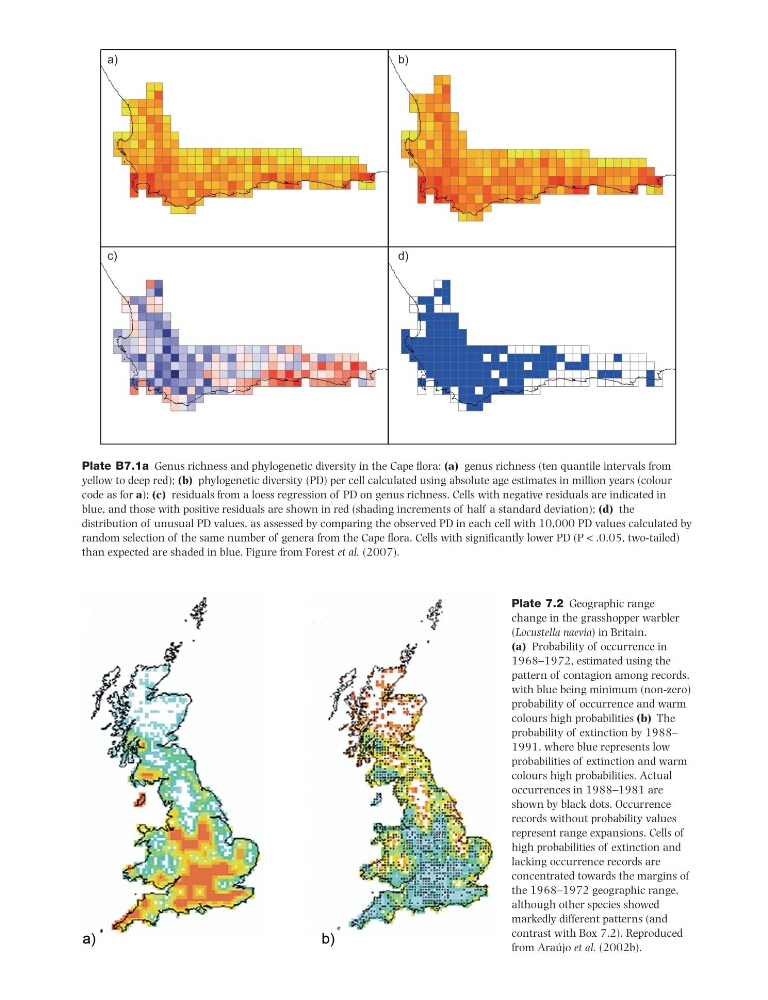
Plate 7.2 Geographic range
change in the grasshopper warbler
(Locustella naevia) in Britain.
(a) Probability of occurrence in
1968–1972, estimated using the
pattern of contagion among records,
with blue being minimum (non-zero)
probability of occurrence and warm
colours high probabilities (b) The
probability of extinction by 1988–
1991, where blue represents low
probabilities of extinction and warm
colours high probabilities. Actual
occurrences in 1988–1981 are
shown by black dots. Occurrence
records without probability values
represent range expansions. Cells of
high probabilities of extinction and
lacking occurrence records are
concentrated towards the margins of
the 1968–1972 geographic range,
although other species showed
markedly different patterns (and
contrast with Box 7.2). Reproduced
from Araújo et al. (2002b).
a)
b)
c)
d)
Plate B7.1a Genus richness and phylogenetic diversity in the Cape fl ora: (a) genus richness (ten quantile intervals from
yellow to deep red); (b) phylogenetic diversity (PD) per cell calculated using absolute age estimates in million years (colour
code as for a); (c) residuals from a loess regression of PD on genus richness. Cells with negative residuals are indicated in
blue, and those with positive residuals are shown in red (shading increments of half a standard deviation); (d) the
distribution of unusual PD values, as assessed by comparing the observed PD in each cell with 10,000 PD values calculated by
random selection of the same number of genera from the Cape fl ora. Cells with signifi cantly lower PD (P < .0.05, two-tailed)
than expected are shaded in blue. Figure from Forest et al. (2007).
change in the grasshopper warbler
(Locustella naevia) in Britain.
(a) Probability of occurrence in
1968–1972, estimated using the
pattern of contagion among records,
with blue being minimum (non-zero)
probability of occurrence and warm
colours high probabilities (b) The
probability of extinction by 1988–
1991, where blue represents low
probabilities of extinction and warm
colours high probabilities. Actual
occurrences in 1988–1981 are
shown by black dots. Occurrence
records without probability values
represent range expansions. Cells of
high probabilities of extinction and
lacking occurrence records are
concentrated towards the margins of
the 1968–1972 geographic range,
although other species showed
markedly different patterns (and
contrast with Box 7.2). Reproduced
from Araújo et al. (2002b).
a)
b)
c)
d)
Plate B7.1a Genus richness and phylogenetic diversity in the Cape fl ora: (a) genus richness (ten quantile intervals from
yellow to deep red); (b) phylogenetic diversity (PD) per cell calculated using absolute age estimates in million years (colour
code as for a); (c) residuals from a loess regression of PD on genus richness. Cells with negative residuals are indicated in
blue, and those with positive residuals are shown in red (shading increments of half a standard deviation); (d) the
distribution of unusual PD values, as assessed by comparing the observed PD in each cell with 10,000 PD values calculated by
random selection of the same number of genera from the Cape fl ora. Cells with signifi cantly lower PD (P < .0.05, two-tailed)
than expected are shaded in blue. Figure from Forest et al. (2007).