

238
Biological invasions and the homogenization of faunas and fl oras
initially having a smaller homogenizing effect than the
differentiating effect of extra - regional introductions
(Figure 9.6 ).
9.4 ENVIRONMENTAL AND HUMAN
DRIVERS OF BIOTIC
HOMOGENIZATION
Environmental change ultimately promotes the geographical expansion of some species and the geographical reduction of others, leading to biotic homogenization
(McKinney & Lockwood, 1999 ). Habitat loss, pollution,
climate change or other sources of disturbance often
precede, and in a sense prepare, the environment for
changes in beta diversity over time. The research highlighted above, in addition to a number of other studies
in the literature, has provided compelling evidence
linking human - induced environmental change to
biotic homogenization across taxonomic groups.
Collectively, this research has shown that human activities on the landscape are often characterized by greater
increases in taxonomic similarity, suggesting that
41 nations located worldwide. They found that between
1965 and 2005, ungulate assemblages had become
two per cent more similar for countries globally and
eight per cent more similar at the coarsest resolution
within South Africa.
Interestingly, species introduced from other continents, as opposed to those introduced from within
Africa, were found to have different effects on patterns
of homogenization. Homogenization was most affected
by translocations of species from neighbouring localities (extra - limital species) (4.6 per cent increase in
similarity), whereas introductions of ungulates from
more distant areas (extra - regional species) tended to
differentiate assemblages (3.8 per cent decreased in
similarity). Quite simply, non - native species introduced
from distant regions are more likely to establish in only
a few localities, resulting in differentiation.
Similar fi ndings have also been reported for plants
and freshwater fi shes in the United States (McKinney,
2005 ; LaSorte & McKinney, 2006 ). Levels of homogenization were found to increase with increasing
resolution (see Table 9.2 ) and with time. In the South
African study, from 1971 to 2005, homogenization
by extra - limital introductions increased rapidly after
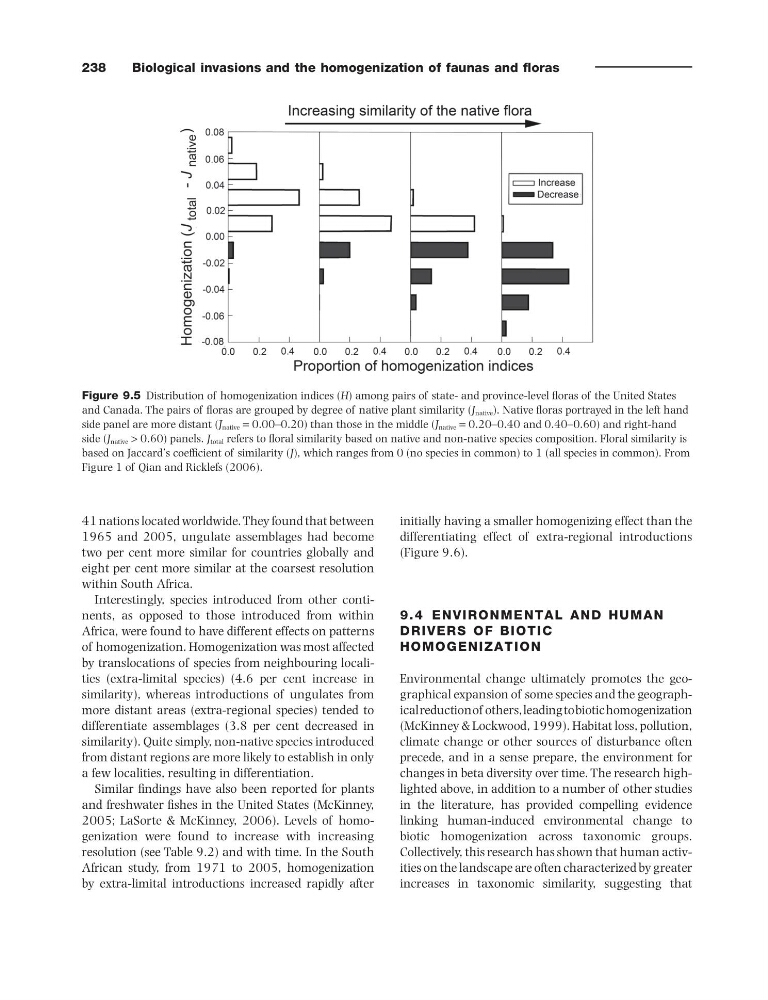
Figure 9.5 Distribution of homogenization indices ( H ) among pairs of state - and province - level fl oras of the United States
and Canada. The pairs of fl oras are grouped by degree of native plant similarity ( J native ). Native fl oras portrayed in the left hand
side panel are more distant ( J native = 0.00 – 0.20) than those in the middle ( J native = 0.20 – 0.40 and 0.40 – 0.60) and right - hand
side ( J native > 0.60) panels. J total refers to fl oral similarity based on native and non - native species composition. Floral similarity is
based on Jaccard ’ s coeffi cient of similarity ( J ), which ranges from 0 (no species in common) to 1 (all species in common). From
Figure 1 of Qian and Ricklefs (2006) .
Biological invasions and the homogenization of faunas and fl oras
initially having a smaller homogenizing effect than the
differentiating effect of extra - regional introductions
(Figure 9.6 ).
9.4 ENVIRONMENTAL AND HUMAN
DRIVERS OF BIOTIC
HOMOGENIZATION
Environmental change ultimately promotes the geographical expansion of some species and the geographical reduction of others, leading to biotic homogenization
(McKinney & Lockwood, 1999 ). Habitat loss, pollution,
climate change or other sources of disturbance often
precede, and in a sense prepare, the environment for
changes in beta diversity over time. The research highlighted above, in addition to a number of other studies
in the literature, has provided compelling evidence
linking human - induced environmental change to
biotic homogenization across taxonomic groups.
Collectively, this research has shown that human activities on the landscape are often characterized by greater
increases in taxonomic similarity, suggesting that
41 nations located worldwide. They found that between
1965 and 2005, ungulate assemblages had become
two per cent more similar for countries globally and
eight per cent more similar at the coarsest resolution
within South Africa.
Interestingly, species introduced from other continents, as opposed to those introduced from within
Africa, were found to have different effects on patterns
of homogenization. Homogenization was most affected
by translocations of species from neighbouring localities (extra - limital species) (4.6 per cent increase in
similarity), whereas introductions of ungulates from
more distant areas (extra - regional species) tended to
differentiate assemblages (3.8 per cent decreased in
similarity). Quite simply, non - native species introduced
from distant regions are more likely to establish in only
a few localities, resulting in differentiation.
Similar fi ndings have also been reported for plants
and freshwater fi shes in the United States (McKinney,
2005 ; LaSorte & McKinney, 2006 ). Levels of homogenization were found to increase with increasing
resolution (see Table 9.2 ) and with time. In the South
African study, from 1971 to 2005, homogenization
by extra - limital introductions increased rapidly after
Figure 9.5 Distribution of homogenization indices ( H ) among pairs of state - and province - level fl oras of the United States
and Canada. The pairs of fl oras are grouped by degree of native plant similarity ( J native ). Native fl oras portrayed in the left hand
side panel are more distant ( J native = 0.00 – 0.20) than those in the middle ( J native = 0.20 – 0.40 and 0.40 – 0.60) and right - hand
side ( J native > 0.60) panels. J total refers to fl oral similarity based on native and non - native species composition. Floral similarity is
based on Jaccard ’ s coeffi cient of similarity ( J ), which ranges from 0 (no species in common) to 1 (all species in common). From
Figure 1 of Qian and Ricklefs (2006) .