

200
Applied island biogeography
• Stage 4. Deleterious effects of isolation. Some populations may be rescued from extinction by migration
and recruitment of individuals from other populations.
The likelihood of such rescue effects decreases as isolation increases.
• Stage 5. Ecological imbalance. Most species are
strongly infl uenced by interactions with other species.
Loss of one species during any of the aforementioned
stages of relaxation may result in the subsequent loss
of its predators, parasites, mutualists, or commensals
(e.g. Koh et al. , 2004 ). In addition, habitat disturbance
and reductions in community diversity during the
earlier stages of relaxation may facilitate the establishment of introduced species, triggering a cascade of
subsequent extirpations.
point, the island has found its new, lower equilibrium
richness level (Figure 8.1 ). The time taken for relaxation to occur is referred to as the ‘ lag time ’ and the
anticipated eventual species loss is termed the ‘ extinction debt ’ (see Ewers & Didham, 2006 ).
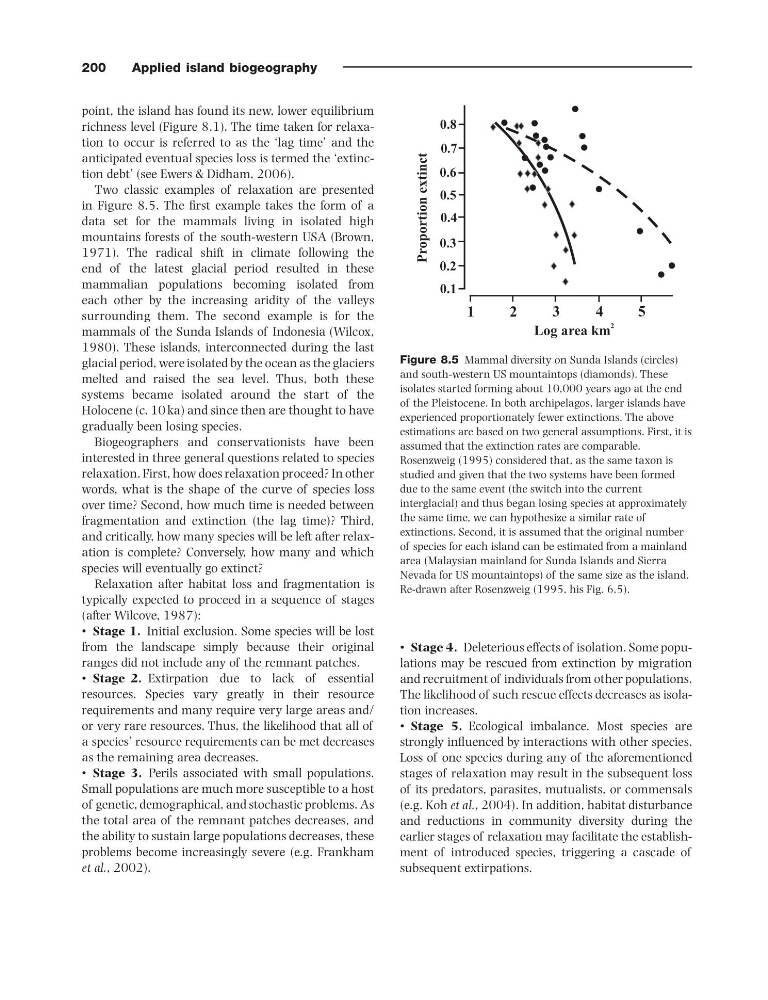
Two classic examples of relaxation are presented
in Figure 8.5 . The fi rst example takes the form of a
data set for the mammals living in isolated high
mountains forests of the south - western USA (Brown,
1971 ). The radical shift in climate following the
end of the latest glacial period resulted in these
mammalian populations becoming isolated from
each other by the increasing aridity of the valleys
surrounding them. The second example is for the
mammals of the Sunda Islands of Indonesia (Wilcox,
1980 ). These islands, interconnected during the last
glacial period, were isolated by the ocean as the glaciers
melted and raised the sea level. Thus, both these
systems became isolated around the start of the
Holocene (c. 10 ka) and since then are thought to have
gradually been losing species.
Biogeographers and conservationists have been
interested in three general questions related to species
relaxation. First, how does relaxation proceed? In other
words, what is the shape of the curve of species loss
over time? Second, how much time is needed between
fragmentation and extinction (the lag time)? Third,
and critically, how many species will be left after relaxation is complete? Conversely, how many and which
species will eventually go extinct?
Relaxation after habitat loss and fragmentation is
typically expected to proceed in a sequence of stages
(after Wilcove, 1987 ):
• Stage 1. Initial exclusion. Some species will be lost
from the landscape simply because their original
ranges did not include any of the remnant patches.
• Stage 2. Extirpation due to lack of essential
resources. Species vary greatly in their resource
requirements and many require very large areas and/
or very rare resources. Thus, the likelihood that all of
a species ’ resource requirements can be met decreases
as the remaining area decreases.
• Stage 3. Perils associated with small populations.
Small populations are much more susceptible to a host
of genetic, demographical, and stochastic problems. As
the total area of the remnant patches decreases, and
the ability to sustain large populations decreases, these
problems become increasingly severe (e.g. Frankham
et al. , 2002 ).
Figure 8.5 Mammal diversity on Sunda Islands (circles)
and south - western US mountaintops (diamonds). These
isolates started forming about 10,000 years ago at the end
of the Pleistocene. In both archipelagos, larger islands have
experienced proportionately fewer extinctions. The above
estimations are based on two general assumptions. First, it is
assumed that the extinction rates are comparable.
Rosenzweig (1995) considered that, as the same taxon is
studied and given that the two systems have been formed
due to the same event (the switch into the current
interglacial) and thus began losing species at approximately
the same time, we can hypothesize a similar rate of
extinctions. Second, it is assumed that the original number
of species for each island can be estimated from a mainland
area (Malaysian mainland for Sunda Islands and Sierra
Nevada for US mountaintops) of the same size as the island.
Re - drawn after Rosenzweig ( 1995 , his Fig. 6.5).
2
1
0.1
0.2
0.3
0.4
0.5
0.6
0.7
0.8
5
3
4
Applied island biogeography
• Stage 4. Deleterious effects of isolation. Some populations may be rescued from extinction by migration
and recruitment of individuals from other populations.
The likelihood of such rescue effects decreases as isolation increases.
• Stage 5. Ecological imbalance. Most species are
strongly infl uenced by interactions with other species.
Loss of one species during any of the aforementioned
stages of relaxation may result in the subsequent loss
of its predators, parasites, mutualists, or commensals
(e.g. Koh et al. , 2004 ). In addition, habitat disturbance
and reductions in community diversity during the
earlier stages of relaxation may facilitate the establishment of introduced species, triggering a cascade of
subsequent extirpations.
point, the island has found its new, lower equilibrium
richness level (Figure 8.1 ). The time taken for relaxation to occur is referred to as the ‘ lag time ’ and the
anticipated eventual species loss is termed the ‘ extinction debt ’ (see Ewers & Didham, 2006 ).
Two classic examples of relaxation are presented
in Figure 8.5 . The fi rst example takes the form of a
data set for the mammals living in isolated high
mountains forests of the south - western USA (Brown,
1971 ). The radical shift in climate following the
end of the latest glacial period resulted in these
mammalian populations becoming isolated from
each other by the increasing aridity of the valleys
surrounding them. The second example is for the
mammals of the Sunda Islands of Indonesia (Wilcox,
1980 ). These islands, interconnected during the last
glacial period, were isolated by the ocean as the glaciers
melted and raised the sea level. Thus, both these
systems became isolated around the start of the
Holocene (c. 10 ka) and since then are thought to have
gradually been losing species.
Biogeographers and conservationists have been
interested in three general questions related to species
relaxation. First, how does relaxation proceed? In other
words, what is the shape of the curve of species loss
over time? Second, how much time is needed between
fragmentation and extinction (the lag time)? Third,
and critically, how many species will be left after relaxation is complete? Conversely, how many and which
species will eventually go extinct?
Relaxation after habitat loss and fragmentation is
typically expected to proceed in a sequence of stages
(after Wilcove, 1987 ):
• Stage 1. Initial exclusion. Some species will be lost
from the landscape simply because their original
ranges did not include any of the remnant patches.
• Stage 2. Extirpation due to lack of essential
resources. Species vary greatly in their resource
requirements and many require very large areas and/
or very rare resources. Thus, the likelihood that all of
a species ’ resource requirements can be met decreases
as the remaining area decreases.
• Stage 3. Perils associated with small populations.
Small populations are much more susceptible to a host
of genetic, demographical, and stochastic problems. As
the total area of the remnant patches decreases, and
the ability to sustain large populations decreases, these
problems become increasingly severe (e.g. Frankham
et al. , 2002 ).
Figure 8.5 Mammal diversity on Sunda Islands (circles)
and south - western US mountaintops (diamonds). These
isolates started forming about 10,000 years ago at the end
of the Pleistocene. In both archipelagos, larger islands have
experienced proportionately fewer extinctions. The above
estimations are based on two general assumptions. First, it is
assumed that the extinction rates are comparable.
Rosenzweig (1995) considered that, as the same taxon is
studied and given that the two systems have been formed
due to the same event (the switch into the current
interglacial) and thus began losing species at approximately
the same time, we can hypothesize a similar rate of
extinctions. Second, it is assumed that the original number
of species for each island can be estimated from a mainland
area (Malaysian mainland for Sunda Islands and Sierra
Nevada for US mountaintops) of the same size as the island.
Re - drawn after Rosenzweig ( 1995 , his Fig. 6.5).
2
1
0.1
0.2
0.3
0.4
0.5
0.6
0.7
0.8
5
3
4