

Conservation planning in a changing world
199
8.2.2 Relaxation and the e xtinction d ebt
Newly emerged islands present new habitat and accumulate species through time via immigration. In contrast, habitat islands created through isolation by
rising water levels or by habitat destruction (e.g. deforestation) are typically assumed to support something
approximating a full complement of local species at
their formation. That is, they are expected to contain
both source populations (having positive population
growth within the area itself) and sink or casual populations that happened to be present at the time of isolation, but which do not exhibit positive population
growth within the area itself. Upon iso lation these
islands are thus ‘ supersaturated ’ for a patch of their
newly reduced area and increased isolation.
With time, these islands lose species, a phenomenon
called species relaxation (Diamond, 1972 ; Wilcox,
1980 ). Immigration (at a lower rate than before) and
extinction (at a higher rate than before isolation)
should both continue during the relaxation period and
subsequently they come back into balance; at this
series of habitat islands. Therefore, treating what are
actually archipelagos of habitat islands as though they
were a single island in analyses of extinction threat is
a potentially crucial oversimplifi cation – and it is one
reason why we cannot rely upon the ‘ 90 per cent area
loss = 50 per cent species loss ’ generalization with
which we began this section.
As a further note of caution, it is important to
emphasize that while the species – area relationship is
indeed a very general pattern, area rarely explains
all interpretable variation in species richness, with
some residual variation being attributable not only to
system isolation but to other variables such as habitat
diversity, elevational range, disturbance regime, etc.
(Whittaker & Fern á ndez - Palacios, 2007 ; Triantis
et al. , 2008 ). It follows that SARs can only provide a
crude approximation for use in conservation planning.
Hence, as noted by Whittaker et al . (2005) , the application of the species – area relationship for informing conservation sciences is one area within conservation
biogeography where the theory appears to require
further work.
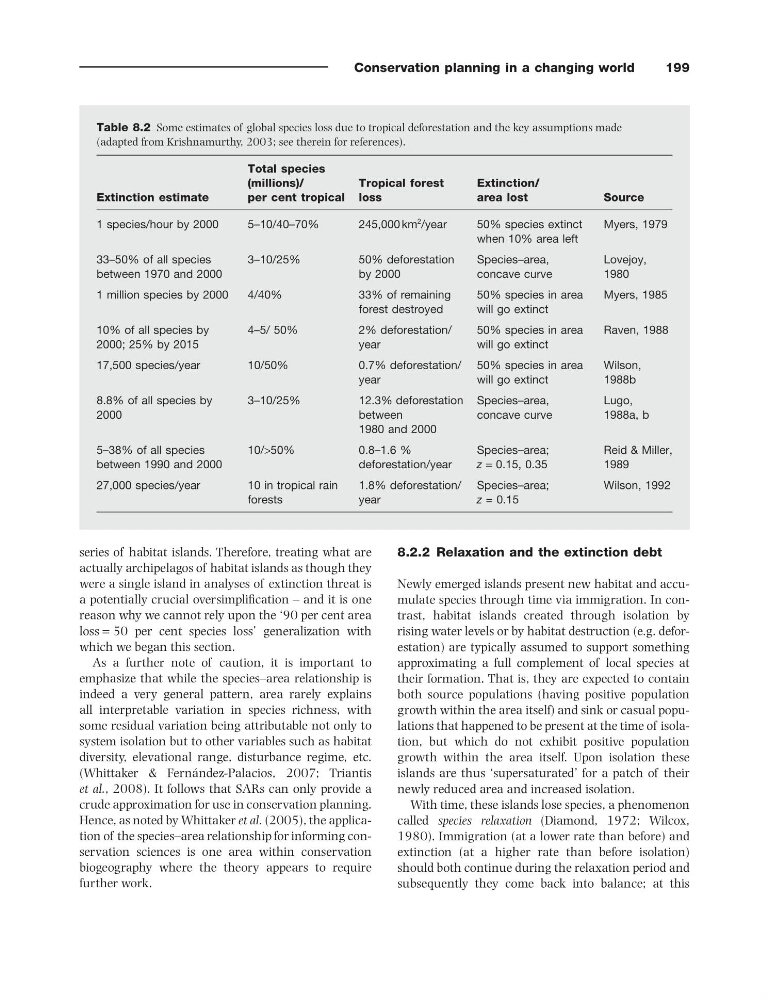
Table 8.2 Some estimates of global species loss due to tropical deforestation and the key assumptions made
(adapted from Krishnamurthy, 2003 ; see therein for references) .
Extinction estimate
Total species
(millions)/
per cent tropical
Tropical forest
loss
Extinction/
area lost
Source
1 species/hour by 2000
5 – 10/40 – 70%
245,000 km
2 /year
50% species extinct
when 10% area left
Myers, 1979
33 – 50% of all species
between 1970 and 2000
3 – 10/25%
50% deforestation
by 2000
Species – area,
concave curve
Lovejoy,
1980
1 million species by 2000
4/40%
33% of remaining
forest destroyed
50% species in area
will go extinct
Myers, 1985
10% of all species by
2000; 25% by 2015
4 – 5/ 50%
2% deforestation/
year
50% species in area
will go extinct
Raven, 1988
17,500 species/year
10/50%
0.7% deforestation/
year
50% species in area
will go extinct
Wilson,
1988b
8.8% of all species by
2000
3 – 10/25%
12.3% deforestation
between
1980 and 2000
Species – area,
concave curve
Lugo,
1988a, b
5 – 38% of all species
between 1990 and 2000
10/ > 50%
0.8 – 1.6 %
deforestation/year
Species – area;
z = 0.15, 0.35
Reid & Miller,
1989
27,000 species/year
10 in tropical rain
forests
1.8% deforestation/
year
Species – area;
z = 0.15
Wilson, 1992
199
8.2.2 Relaxation and the e xtinction d ebt
Newly emerged islands present new habitat and accumulate species through time via immigration. In contrast, habitat islands created through isolation by
rising water levels or by habitat destruction (e.g. deforestation) are typically assumed to support something
approximating a full complement of local species at
their formation. That is, they are expected to contain
both source populations (having positive population
growth within the area itself) and sink or casual populations that happened to be present at the time of isolation, but which do not exhibit positive population
growth within the area itself. Upon iso lation these
islands are thus ‘ supersaturated ’ for a patch of their
newly reduced area and increased isolation.
With time, these islands lose species, a phenomenon
called species relaxation (Diamond, 1972 ; Wilcox,
1980 ). Immigration (at a lower rate than before) and
extinction (at a higher rate than before isolation)
should both continue during the relaxation period and
subsequently they come back into balance; at this
series of habitat islands. Therefore, treating what are
actually archipelagos of habitat islands as though they
were a single island in analyses of extinction threat is
a potentially crucial oversimplifi cation – and it is one
reason why we cannot rely upon the ‘ 90 per cent area
loss = 50 per cent species loss ’ generalization with
which we began this section.
As a further note of caution, it is important to
emphasize that while the species – area relationship is
indeed a very general pattern, area rarely explains
all interpretable variation in species richness, with
some residual variation being attributable not only to
system isolation but to other variables such as habitat
diversity, elevational range, disturbance regime, etc.
(Whittaker & Fern á ndez - Palacios, 2007 ; Triantis
et al. , 2008 ). It follows that SARs can only provide a
crude approximation for use in conservation planning.
Hence, as noted by Whittaker et al . (2005) , the application of the species – area relationship for informing conservation sciences is one area within conservation
biogeography where the theory appears to require
further work.
Table 8.2 Some estimates of global species loss due to tropical deforestation and the key assumptions made
(adapted from Krishnamurthy, 2003 ; see therein for references) .
Extinction estimate
Total species
(millions)/
per cent tropical
Tropical forest
loss
Extinction/
area lost
Source
1 species/hour by 2000
5 – 10/40 – 70%
245,000 km
2 /year
50% species extinct
when 10% area left
Myers, 1979
33 – 50% of all species
between 1970 and 2000
3 – 10/25%
50% deforestation
by 2000
Species – area,
concave curve
Lovejoy,
1980
1 million species by 2000
4/40%
33% of remaining
forest destroyed
50% species in area
will go extinct
Myers, 1985
10% of all species by
2000; 25% by 2015
4 – 5/ 50%
2% deforestation/
year
50% species in area
will go extinct
Raven, 1988
17,500 species/year
10/50%
0.7% deforestation/
year
50% species in area
will go extinct
Wilson,
1988b
8.8% of all species by
2000
3 – 10/25%
12.3% deforestation
between
1980 and 2000
Species – area,
concave curve
Lugo,
1988a, b
5 – 38% of all species
between 1990 and 2000
10/ > 50%
0.8 – 1.6 %
deforestation/year
Species – area;
z = 0.15, 0.35
Reid & Miller,
1989
27,000 species/year
10 in tropical rain
forests
1.8% deforestation/
year
Species – area;
z = 0.15
Wilson, 1992