

196
Applied island biogeography
Box 8.1 Scale and the s pecies – a rea r elationship ( SAR )
Box prepared by R.J. Whittaker and K.A. Triantis – excerpted and modifi ed slightly from Triantis,
Mylonas and Whittaker (2008) .
Scales and t ypes of SAR
The species – area relationship (SAR) – the increase in species number with increasing area – is one of the best -
documented general patterns in biogeography and ecology, yet controversy persists about the best means of
describing the relationship and about the precise form of different types and/or scales of SAR.
SARs are typically described using power functions where the exponent (i.e. the slope of the log - area/log -
richness relationship) is commonly referred to as the z - parameter. The z - parameter has a simple mathematical
interpretation: it is the rate at which species accumulate with increasing area. However, there is no consensus
on the biological interpretation and scale dependency (e.g. at which spatial scales particular evolutionary and
ecological processes predominate) of SARs.
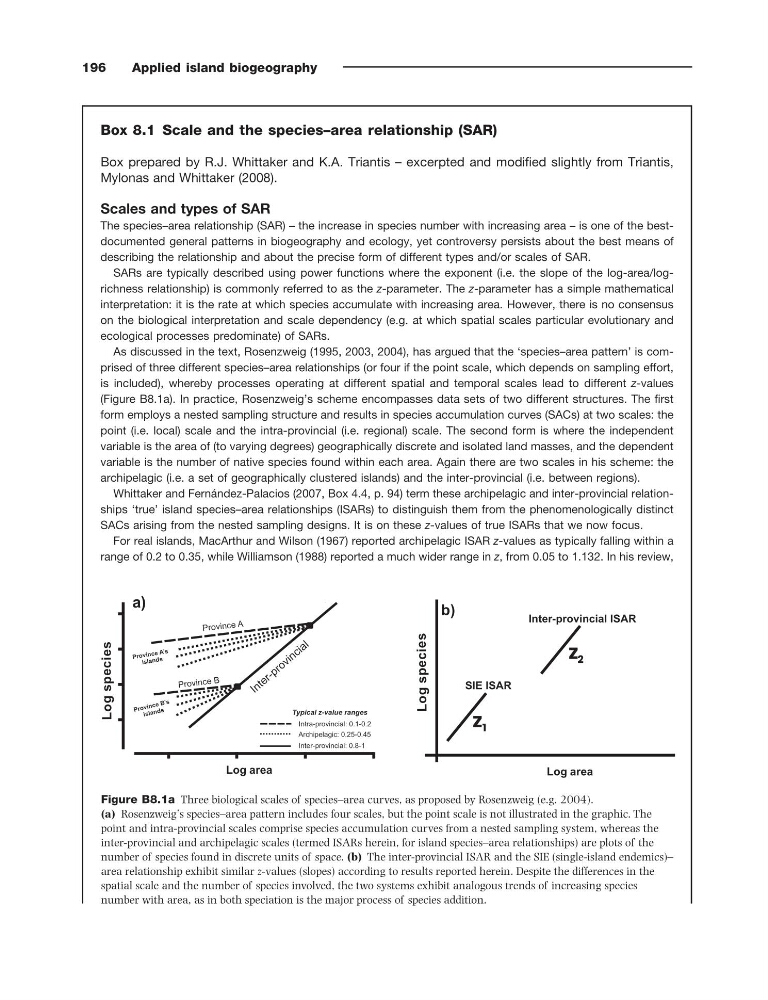
As discussed in the text, Rosenzweig (1995, 2003, 2004) , has argued that the ‘ species – area pattern ’ is comprised of three different species – area relationships (or four if the point scale, which depends on sampling effort,
is included), whereby processes operating at different spatial and temporal scales lead to different z - values
(Figure B8.1a ). In practice, Rosenzweig ’ s scheme encompasses data sets of two different structures. The fi rst
form employs a nested sampling structure and results in species accumulation curves (SACs) at two scales: the
point (i.e. local) scale and the intra - provincial (i.e. regional) scale. The second form is where the independent
variable is the area of (to varying degrees) geographically discrete and isolated land masses, and the dependent
variable is the number of native species found within each area. Again there are two scales in his scheme: the
archipelagic (i.e. a set of geographically clustered islands) and the inter - provincial (i.e. between regions).
Whittaker and Fern á ndez - Palacios ( 2007 , Box 4.4, p. 94) term these archipelagic and inter - provincial relationships ‘ true ’ island species – area relationships (ISARs) to distinguish them from the phenomenologically distinct
SACs arising from the nested sampling designs. It is on these z - values of true ISARs that we now focus.
For real islands, MacArthur and Wilson (1967) reported archipelagic ISAR z - values as typically falling within a
range of 0.2 to 0.35, while Williamson (1988) reported a much wider range in z , from 0.05 to 1.132. In his review,
Figure B8.1a Three biological scales of species – area curves, as proposed by Rosenzweig (e.g. 2004 ).
(a) Rosenzweig ’ s species – area pattern includes four scales, but the point scale is not illustrated in the graphic. The
point and intra - provincial scales comprise species accumulation curves from a nested sampling system, whereas the
inter - provincial and archipelagic scales (termed ISARs herein, for island species – area relationships) are plots of the
number of species found in discrete units of space. (b) The inter - provincial ISAR and the SIE (single - island endemics) –
area relationship exhibit similar z - values (slopes) according to results reported herein. Despite the differences in the
spatial scale and the number of species involved, the two systems exhibit analogous trends of increasing species
number with area, as in both speciation is the major process of species addition.
Log
species
Log area
SIE ISAR
z 1
z 2
Inter-provincial ISAR
b)
Archipelagic: 0.25-0.45
Intra-provincial: 0.1-0.2
Typical z-value ranges
Inter-provincial: 0.8-1
Prov ince A
Pro vin ce A’s
isla nds
Pr ov inc e B’s
isl an ds
Pro vinc e B
I n t e r - p r o v i n c i a l
Log
species
Log area
a)
Applied island biogeography
Box 8.1 Scale and the s pecies – a rea r elationship ( SAR )
Box prepared by R.J. Whittaker and K.A. Triantis – excerpted and modifi ed slightly from Triantis,
Mylonas and Whittaker (2008) .
Scales and t ypes of SAR
The species – area relationship (SAR) – the increase in species number with increasing area – is one of the best -
documented general patterns in biogeography and ecology, yet controversy persists about the best means of
describing the relationship and about the precise form of different types and/or scales of SAR.
SARs are typically described using power functions where the exponent (i.e. the slope of the log - area/log -
richness relationship) is commonly referred to as the z - parameter. The z - parameter has a simple mathematical
interpretation: it is the rate at which species accumulate with increasing area. However, there is no consensus
on the biological interpretation and scale dependency (e.g. at which spatial scales particular evolutionary and
ecological processes predominate) of SARs.
As discussed in the text, Rosenzweig (1995, 2003, 2004) , has argued that the ‘ species – area pattern ’ is comprised of three different species – area relationships (or four if the point scale, which depends on sampling effort,
is included), whereby processes operating at different spatial and temporal scales lead to different z - values
(Figure B8.1a ). In practice, Rosenzweig ’ s scheme encompasses data sets of two different structures. The fi rst
form employs a nested sampling structure and results in species accumulation curves (SACs) at two scales: the
point (i.e. local) scale and the intra - provincial (i.e. regional) scale. The second form is where the independent
variable is the area of (to varying degrees) geographically discrete and isolated land masses, and the dependent
variable is the number of native species found within each area. Again there are two scales in his scheme: the
archipelagic (i.e. a set of geographically clustered islands) and the inter - provincial (i.e. between regions).
Whittaker and Fern á ndez - Palacios ( 2007 , Box 4.4, p. 94) term these archipelagic and inter - provincial relationships ‘ true ’ island species – area relationships (ISARs) to distinguish them from the phenomenologically distinct
SACs arising from the nested sampling designs. It is on these z - values of true ISARs that we now focus.
For real islands, MacArthur and Wilson (1967) reported archipelagic ISAR z - values as typically falling within a
range of 0.2 to 0.35, while Williamson (1988) reported a much wider range in z , from 0.05 to 1.132. In his review,
Figure B8.1a Three biological scales of species – area curves, as proposed by Rosenzweig (e.g. 2004 ).
(a) Rosenzweig ’ s species – area pattern includes four scales, but the point scale is not illustrated in the graphic. The
point and intra - provincial scales comprise species accumulation curves from a nested sampling system, whereas the
inter - provincial and archipelagic scales (termed ISARs herein, for island species – area relationships) are plots of the
number of species found in discrete units of space. (b) The inter - provincial ISAR and the SIE (single - island endemics) –
area relationship exhibit similar z - values (slopes) according to results reported herein. Despite the differences in the
spatial scale and the number of species involved, the two systems exhibit analogous trends of increasing species
number with area, as in both speciation is the major process of species addition.
Log
species
Log area
SIE ISAR
z 1
z 2
Inter-provincial ISAR
b)
Archipelagic: 0.25-0.45
Intra-provincial: 0.1-0.2
Typical z-value ranges
Inter-provincial: 0.8-1
Prov ince A
Pro vin ce A’s
isla nds
Pr ov inc e B’s
isl an ds
Pro vinc e B
I n t e r - p r o v i n c i a l
Log
species
Log area
a)