

194
Applied island biogeography
model: S = cA
z
, while Gleason (1922) suggested a
semi - logarithmic model S = k + d log A , where S is the
number of species, A is (island) area, and c , z , k and d
are constants. Quantifi cation was a critical, long -
awaited advance, primarily because it enabled scientifi -
cally rigorous investigations of species – area curves,
therefore allowing biogeographers and ecologists to
use comparative methods to search for and evaluate
causal explanations. Ultimately, this breakthrough
allowed modern - day conservation biogeographers to
apply species – area models to make predictions and
develop strategies for conserving biological diversity
(see Lomolino, 2001 ).
Today, more than 20 mathematical models have
been proposed for the description of the SAR, with the
power model of Arrhenius being still the most commonly applied and frequently the most effective (see
Connor & McCoy, 1979 ; Tj ø rve, 2009 ; and see Williams
et al. , 2009 , for a comprehensive review of all the
available models and their appropriate usage).
The next key breakthrough was by Frank Preston,
an engineer and naturalist, who proposed a mechanistic explanation of the species – area pattern and for the
values that the slope of the relationship in a logarithmic space should take. His starting point was a
theoretical consideration of the species abundance
distribution, which he argued typically followed a log –
normal distribution (Preston, 1948, 1962 ).
The theory states that the most numerous species are
those of middling abundance, while species with very
few individuals are as rare as species with a very large
number of individuals, giving rise to a log – normal
to expect habitat islands to behave according to the
same principles as real islands? In answering this
question, we critically review the application of ideas
derived from island ecological biogeography to conservation problems and suggest a number of future directions where island theory can potentially inform
applied conservation questions.
8.2 IMPLICATIONS OF HABITAT LOSS
AND FRAGMENTATION: FROM
THEORY TO EVIDENCE
A theory is more impressive the greater the simplicity of its premises, the more different the kinds of
things it relates and the more extended its range of
applicability.
(Albert Einstein, 1949, from Schlipp
( 1973 , p. 33) .
8.2.1 The u se of s pecies – a rea r elationships
in c onservation
A basic rule of thumb derived from island theory is that
if a habitat is reduced by 90 per cent, then some 50 per
cent of species are expected to go extinct. In this and
the following section, we explore this rule of thumb
and consider the extent to which we can rely upon
such simple generalizations.
The species – area relationship (SAR) is not simply
one of ecology ’ s most general patterns but was also
one of the fi rst to be discovered. It also has a profound
importance for conservation biogeography. Descriptions
of the SAR are known from as early as 1778 (Johann
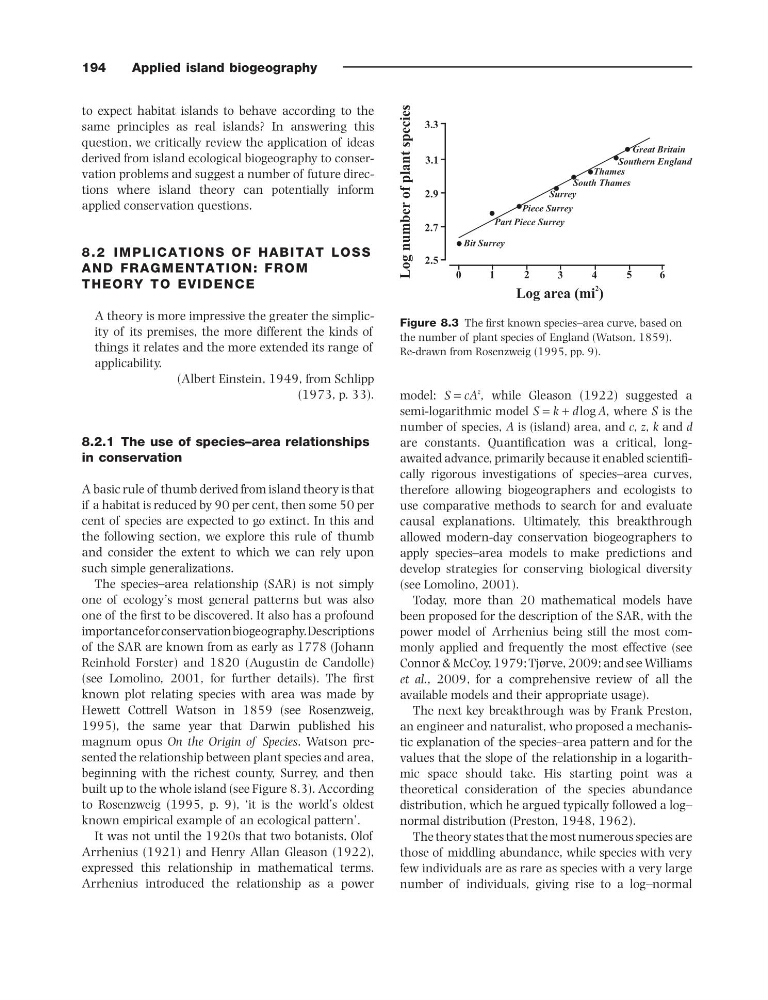
Reinhold Forster) and 1820 (Augustin de Candolle)
(see Lomolino, 2001 , for further details). The fi rst
known plot relating species with area was made by
Hewett Cottrell Watson in 1859 (see Rosenzweig,
1995 ), the same year that Darwin published his
magnum opus On the Origin of Species . Watson presented the relationship between plant species and area,
beginning with the richest county, Surrey, and then
built up to the whole island (see Figure 8.3 ). According
to Rosenzweig ( 1995 , p. 9), ‘ it is the world ’ s oldest
known empirical example of an ecological pattern ’ .
It was not until the 1920s that two botanists, Olof
Arrhenius (1921) and Henry Allan Gleason (1922) ,
expressed this relationship in mathematical terms.
Arrhenius introduced the relationship as a power
Figure 8.3 The fi rst known species – area curve, based on
the number of plant species of England (Watson, 1859 ).
Re - drawn from Rosenzweig ( 1995 , pp. 9).
Bit Surrey
0
2.5
2.7
2.9
3.1
3.3
1
2
3
4
5
6
Part Piece Surrey
Piece Surrey
Surrey
South Thames
Thames
Southern England
Great Britain
Applied island biogeography
model: S = cA
z
, while Gleason (1922) suggested a
semi - logarithmic model S = k + d log A , where S is the
number of species, A is (island) area, and c , z , k and d
are constants. Quantifi cation was a critical, long -
awaited advance, primarily because it enabled scientifi -
cally rigorous investigations of species – area curves,
therefore allowing biogeographers and ecologists to
use comparative methods to search for and evaluate
causal explanations. Ultimately, this breakthrough
allowed modern - day conservation biogeographers to
apply species – area models to make predictions and
develop strategies for conserving biological diversity
(see Lomolino, 2001 ).
Today, more than 20 mathematical models have
been proposed for the description of the SAR, with the
power model of Arrhenius being still the most commonly applied and frequently the most effective (see
Connor & McCoy, 1979 ; Tj ø rve, 2009 ; and see Williams
et al. , 2009 , for a comprehensive review of all the
available models and their appropriate usage).
The next key breakthrough was by Frank Preston,
an engineer and naturalist, who proposed a mechanistic explanation of the species – area pattern and for the
values that the slope of the relationship in a logarithmic space should take. His starting point was a
theoretical consideration of the species abundance
distribution, which he argued typically followed a log –
normal distribution (Preston, 1948, 1962 ).
The theory states that the most numerous species are
those of middling abundance, while species with very
few individuals are as rare as species with a very large
number of individuals, giving rise to a log – normal
to expect habitat islands to behave according to the
same principles as real islands? In answering this
question, we critically review the application of ideas
derived from island ecological biogeography to conservation problems and suggest a number of future directions where island theory can potentially inform
applied conservation questions.
8.2 IMPLICATIONS OF HABITAT LOSS
AND FRAGMENTATION: FROM
THEORY TO EVIDENCE
A theory is more impressive the greater the simplicity of its premises, the more different the kinds of
things it relates and the more extended its range of
applicability.
(Albert Einstein, 1949, from Schlipp
( 1973 , p. 33) .
8.2.1 The u se of s pecies – a rea r elationships
in c onservation
A basic rule of thumb derived from island theory is that
if a habitat is reduced by 90 per cent, then some 50 per
cent of species are expected to go extinct. In this and
the following section, we explore this rule of thumb
and consider the extent to which we can rely upon
such simple generalizations.
The species – area relationship (SAR) is not simply
one of ecology ’ s most general patterns but was also
one of the fi rst to be discovered. It also has a profound
importance for conservation biogeography. Descriptions
of the SAR are known from as early as 1778 (Johann
Reinhold Forster) and 1820 (Augustin de Candolle)
(see Lomolino, 2001 , for further details). The fi rst
known plot relating species with area was made by
Hewett Cottrell Watson in 1859 (see Rosenzweig,
1995 ), the same year that Darwin published his
magnum opus On the Origin of Species . Watson presented the relationship between plant species and area,
beginning with the richest county, Surrey, and then
built up to the whole island (see Figure 8.3 ). According
to Rosenzweig ( 1995 , p. 9), ‘ it is the world ’ s oldest
known empirical example of an ecological pattern ’ .
It was not until the 1920s that two botanists, Olof
Arrhenius (1921) and Henry Allan Gleason (1922) ,
expressed this relationship in mathematical terms.
Arrhenius introduced the relationship as a power
Figure 8.3 The fi rst known species – area curve, based on
the number of plant species of England (Watson, 1859 ).
Re - drawn from Rosenzweig ( 1995 , pp. 9).
Bit Surrey
0
2.5
2.7
2.9
3.1
3.3
1
2
3
4
5
6
Part Piece Surrey
Piece Surrey
Surrey
South Thames
Thames
Southern England
Great Britain