

The distribution of diversity: challenges and applications
91
environmental and (where available) biological data
(UNESCO, 2009 ). At smaller spatial scales, various
habitat classifi cations are also now available, based on
abiotic factors such as geomorphology, exposure, tidal
amplitude and ice regimes, as well as biotic factors
such as species composition (Allee et al ., 2000 ; Connor
et al ., 2004 ).
In summary, marine classifi cations are less well
established than terrestrial ones, and much research
is underway to develop, test, and improve them. While
there is concern that the correlation between abiotic
surrogates and biodiversity distribution can be low
(e.g. abiotic surrogates explained less than 30 per cent
of the variation in biotic data in one study in Australia;
Stevens & Connolly, 2004 ), the lack of available biological data in the sea makes the use of geophysical
data imperative (Roff et al ., 2003 ; Harris & Whiteway,
2009 ).
FOR DISCUSSION
1 In the light of the Linnean and Wallacean shortfalls,
should top priority be given to collection of more data,
to development of better models from existing data, or
to putting present analyses to the service of conservation without delay?
2 Should composition or function have priority in our
efforts to map nature?
3 Should molecular phylogenies be preferred to traditional systematics for identifying ‘ species ’ for conservation decision making?
4 How can molecular biogeographical approaches
such as phylogeography, and bioclimatic envelope
modelling be employed synergistically to inform conservation decisions?
5 How does map scale affect interpretations of biogeographical data available for conservation planning?
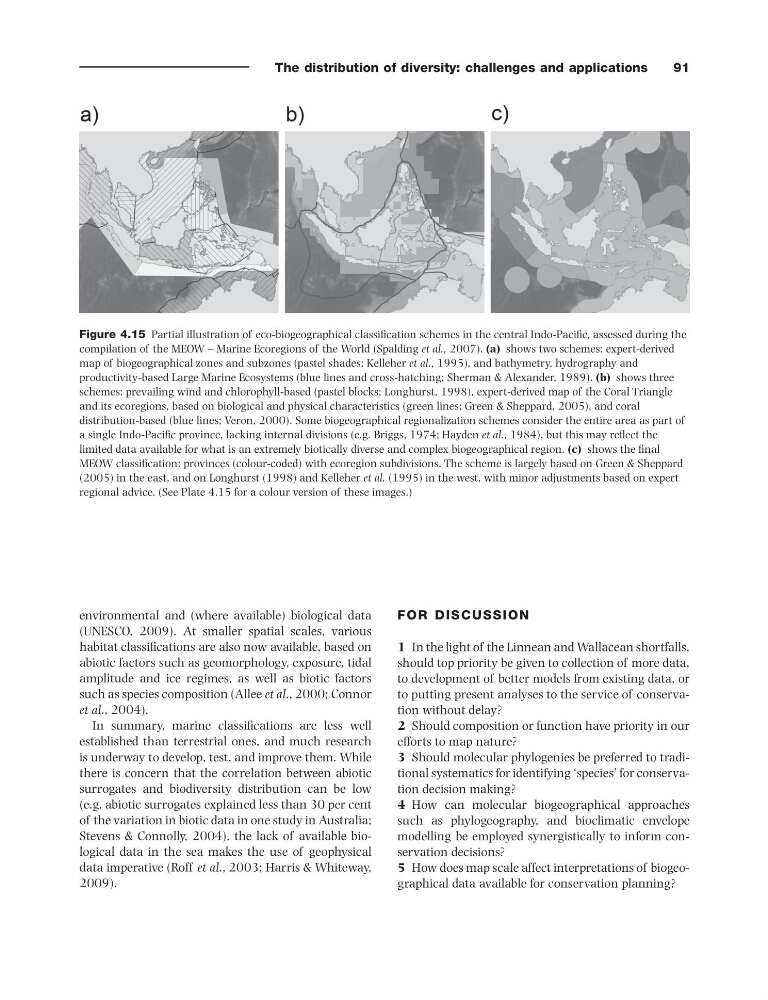
Figure 4.15 Partial illustration of eco - biogeographical classifi cation schemes in the central Indo - Pacifi c, assessed during the
compilation of the MEOW – Marine Ecoregions of the World (Spalding et al., 2007 ). (a) shows two schemes: expert - derived
map of biogeographical zones and subzones (pastel shades; Kelleher et al., 1995 ), and bathymetry, hydrography and
productivity - based Large Marine Ecosystems (blue lines and cross - hatching; Sherman & Alexander, 1989 ). (b) shows three
schemes: prevailing wind and chlorophyll - based (pastel blocks; Longhurst, 1998 ), expert - derived map of the Coral Triangle
and its ecoregions, based on biological and physical characteristics (green lines; Green & Sheppard, 2005 ), and coral
distribution - based (blue lines; Veron, 2000 ). Some biogeographical regionalization schemes consider the entire area as part of
a single Indo - Pacifi c province, lacking internal divisions (e.g. Briggs, 1974 ; Hayden et al. , 1984 ), but this may refl ect the
limited data available for what is an extremely biotically diverse and complex biogeographical region. (c) shows the fi nal
MEOW classifi cation: provinces (colour - coded) with ecoregion subdivisions. The scheme is largely based on Green & Sheppard
(2005) in the east, and on Longhurst (1998) and Kelleher et al. (1995) in the west, with minor adjustments based on expert
regional advice. (See Plate 4.15 for a colour version of these images.)
91
environmental and (where available) biological data
(UNESCO, 2009 ). At smaller spatial scales, various
habitat classifi cations are also now available, based on
abiotic factors such as geomorphology, exposure, tidal
amplitude and ice regimes, as well as biotic factors
such as species composition (Allee et al ., 2000 ; Connor
et al ., 2004 ).
In summary, marine classifi cations are less well
established than terrestrial ones, and much research
is underway to develop, test, and improve them. While
there is concern that the correlation between abiotic
surrogates and biodiversity distribution can be low
(e.g. abiotic surrogates explained less than 30 per cent
of the variation in biotic data in one study in Australia;
Stevens & Connolly, 2004 ), the lack of available biological data in the sea makes the use of geophysical
data imperative (Roff et al ., 2003 ; Harris & Whiteway,
2009 ).
FOR DISCUSSION
1 In the light of the Linnean and Wallacean shortfalls,
should top priority be given to collection of more data,
to development of better models from existing data, or
to putting present analyses to the service of conservation without delay?
2 Should composition or function have priority in our
efforts to map nature?
3 Should molecular phylogenies be preferred to traditional systematics for identifying ‘ species ’ for conservation decision making?
4 How can molecular biogeographical approaches
such as phylogeography, and bioclimatic envelope
modelling be employed synergistically to inform conservation decisions?
5 How does map scale affect interpretations of biogeographical data available for conservation planning?
Figure 4.15 Partial illustration of eco - biogeographical classifi cation schemes in the central Indo - Pacifi c, assessed during the
compilation of the MEOW – Marine Ecoregions of the World (Spalding et al., 2007 ). (a) shows two schemes: expert - derived
map of biogeographical zones and subzones (pastel shades; Kelleher et al., 1995 ), and bathymetry, hydrography and
productivity - based Large Marine Ecosystems (blue lines and cross - hatching; Sherman & Alexander, 1989 ). (b) shows three
schemes: prevailing wind and chlorophyll - based (pastel blocks; Longhurst, 1998 ), expert - derived map of the Coral Triangle
and its ecoregions, based on biological and physical characteristics (green lines; Green & Sheppard, 2005 ), and coral
distribution - based (blue lines; Veron, 2000 ). Some biogeographical regionalization schemes consider the entire area as part of
a single Indo - Pacifi c province, lacking internal divisions (e.g. Briggs, 1974 ; Hayden et al. , 1984 ), but this may refl ect the
limited data available for what is an extremely biotically diverse and complex biogeographical region. (c) shows the fi nal
MEOW classifi cation: provinces (colour - coded) with ecoregion subdivisions. The scheme is largely based on Green & Sheppard
(2005) in the east, and on Longhurst (1998) and Kelleher et al. (1995) in the west, with minor adjustments based on expert
regional advice. (See Plate 4.15 for a colour version of these images.)