

LARGE-SCALE SPATIAL AND TEMPORAL PATTERNS OF DEEP-SEA BENTHIC SPECIES DIVERSITY
307
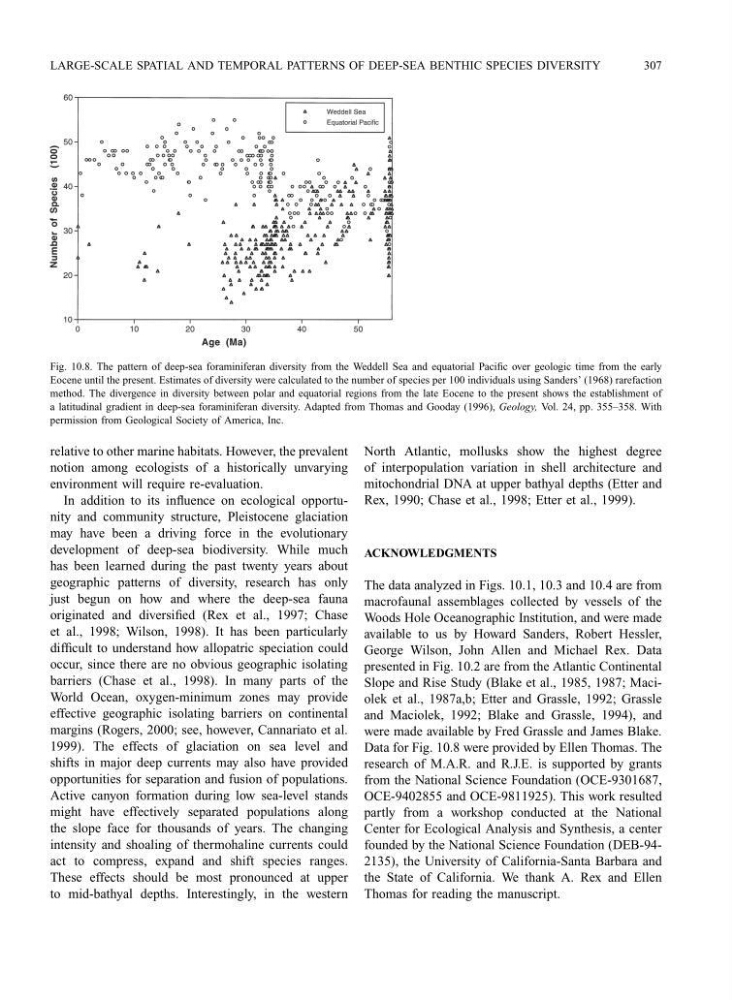
Fig. 10.8. The pattern of deep-sea foraminiferan diversity from the Weddell Sea and equatorial Pacific over geologic time from the early
Eocene until the present. Estimates of diversity were calculated to the number of species per 100 individuals using Sanders’ (1968) rarefaction
method. The divergence in diversity between polar and equatorial regions from the late Eocene to the present shows the establishment of
a latitudinal gradient in deep-sea foraminiferan diversity. Adapted from Thomas and Gooday (1996), Geology, Vol. 24, pp. 355–358. With
permission from Geological Society of America, Inc.
relative to other marine habitats. However, the prevalent
notion among ecologists of a historically unvarying
environment will require re-evaluation.
In addition to its influence on ecological opportunity and community structure, Pleistocene glaciation
may have been a driving force in the evolutionary
development of deep-sea biodiversity. While much
has been learned during the past twenty years about
geographic patterns of diversity, research has only
just begun on how and where the deep-sea fauna
originated and diversified (Rex et al., 1997; Chase
et al., 1998; Wilson, 1998). It has been particularly
difficult to understand how allopatric speciation could
occur, since there are no obvious geographic isolating
barriers (Chase et al., 1998). In many parts of the
World Ocean, oxygen-minimum zones may provide
effective geographic isolating barriers on continental
margins (Rogers, 2000; see, however, Cannariato et al.
1999). The effects of glaciation on sea level and
shifts in major deep currents may also have provided
opportunities for separation and fusion of populations.
Active canyon formation during low sea-level stands
might have effectively separated populations along
the slope face for thousands of years. The changing
intensity and shoaling of thermohaline currents could
act to compress, expand and shift species ranges.
These effects should be most pronounced at upper
to mid-bathyal depths. Interestingly, in the western
North Atlantic, mollusks show the highest degree
of interpopulation variation in shell architecture and
mitochondrial DNA at upper bathyal depths (Etter and
Rex, 1990; Chase et al., 1998; Etter et al., 1999).
ACKNOWLEDGMENTS
The data analyzed in Figs. 10.1, 10.3 and 10.4 are from
macrofaunal assemblages collected by vessels of the
Woods Hole Oceanographic Institution, and were made
available to us by Howard Sanders, Robert Hessler,
George Wilson, John Allen and Michael Rex. Data
presented in Fig. 10.2 are from the Atlantic Continental
Slope and Rise Study (Blake et al., 1985, 1987; Maciolek et al., 1987a,b; Etter and Grassle, 1992; Grassle
and Maciolek, 1992; Blake and Grassle, 1994), and
were made available by Fred Grassle and James Blake.
Data for Fig. 10.8 were provided by Ellen Thomas. The
research of M.A.R. and R.J.E. is supported by grants
from the National Science Foundation (OCE-9301687,
OCE-9402855 and OCE-9811925). This work resulted
partly from a workshop conducted at the National
Center for Ecological Analysis and Synthesis, a center
founded by the National Science Foundation (DEB-942135), the University of California-Santa Barbara and
the State of California. We thank A. Rex and Ellen
Thomas for reading the manuscript.
307
Fig. 10.8. The pattern of deep-sea foraminiferan diversity from the Weddell Sea and equatorial Pacific over geologic time from the early
Eocene until the present. Estimates of diversity were calculated to the number of species per 100 individuals using Sanders’ (1968) rarefaction
method. The divergence in diversity between polar and equatorial regions from the late Eocene to the present shows the establishment of
a latitudinal gradient in deep-sea foraminiferan diversity. Adapted from Thomas and Gooday (1996), Geology, Vol. 24, pp. 355–358. With
permission from Geological Society of America, Inc.
relative to other marine habitats. However, the prevalent
notion among ecologists of a historically unvarying
environment will require re-evaluation.
In addition to its influence on ecological opportunity and community structure, Pleistocene glaciation
may have been a driving force in the evolutionary
development of deep-sea biodiversity. While much
has been learned during the past twenty years about
geographic patterns of diversity, research has only
just begun on how and where the deep-sea fauna
originated and diversified (Rex et al., 1997; Chase
et al., 1998; Wilson, 1998). It has been particularly
difficult to understand how allopatric speciation could
occur, since there are no obvious geographic isolating
barriers (Chase et al., 1998). In many parts of the
World Ocean, oxygen-minimum zones may provide
effective geographic isolating barriers on continental
margins (Rogers, 2000; see, however, Cannariato et al.
1999). The effects of glaciation on sea level and
shifts in major deep currents may also have provided
opportunities for separation and fusion of populations.
Active canyon formation during low sea-level stands
might have effectively separated populations along
the slope face for thousands of years. The changing
intensity and shoaling of thermohaline currents could
act to compress, expand and shift species ranges.
These effects should be most pronounced at upper
to mid-bathyal depths. Interestingly, in the western
North Atlantic, mollusks show the highest degree
of interpopulation variation in shell architecture and
mitochondrial DNA at upper bathyal depths (Etter and
Rex, 1990; Chase et al., 1998; Etter et al., 1999).
ACKNOWLEDGMENTS
The data analyzed in Figs. 10.1, 10.3 and 10.4 are from
macrofaunal assemblages collected by vessels of the
Woods Hole Oceanographic Institution, and were made
available to us by Howard Sanders, Robert Hessler,
George Wilson, John Allen and Michael Rex. Data
presented in Fig. 10.2 are from the Atlantic Continental
Slope and Rise Study (Blake et al., 1985, 1987; Maciolek et al., 1987a,b; Etter and Grassle, 1992; Grassle
and Maciolek, 1992; Blake and Grassle, 1994), and
were made available by Fred Grassle and James Blake.
Data for Fig. 10.8 were provided by Ellen Thomas. The
research of M.A.R. and R.J.E. is supported by grants
from the National Science Foundation (OCE-9301687,
OCE-9402855 and OCE-9811925). This work resulted
partly from a workshop conducted at the National
Center for Ecological Analysis and Synthesis, a center
founded by the National Science Foundation (DEB-942135), the University of California-Santa Barbara and
the State of California. We thank A. Rex and Ellen
Thomas for reading the manuscript.