

278
Paul A. TYLER
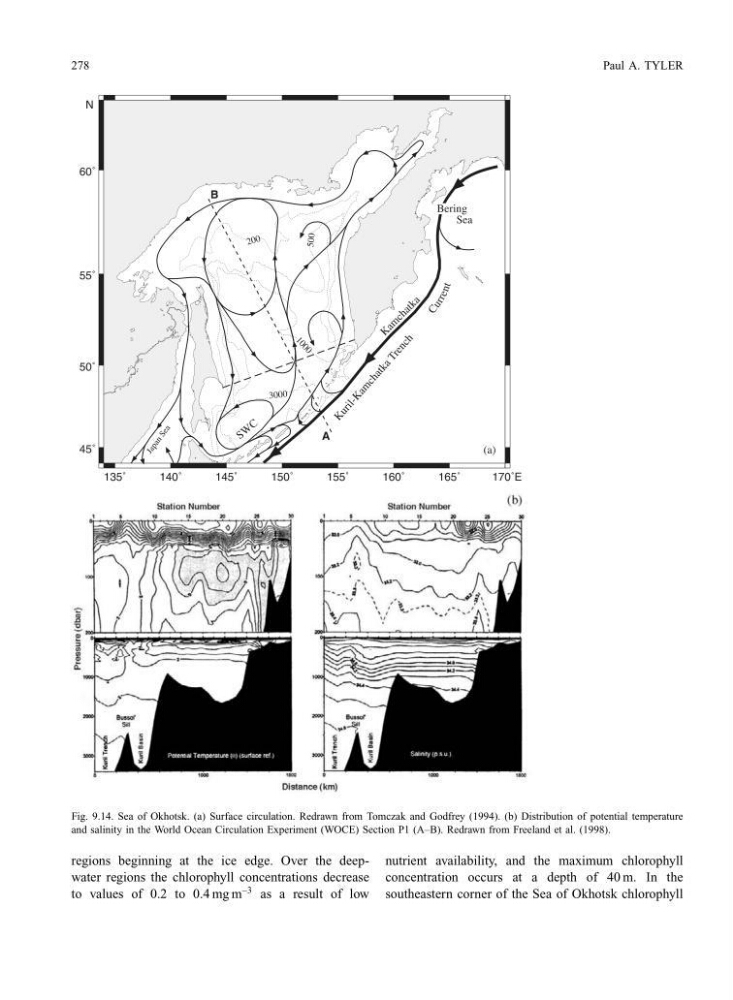
Fig. 9.14. Sea of Okhotsk. (a) Surface circulation. Redrawn from Tomczak and Godfrey (1994). (b) Distribution of potential temperature
and salinity in the World Ocean Circulation Experiment (WOCE) Section P1 (A–B). Redrawn from Freeland et al. (1998).
regions beginning at the ice edge. Over the deepwater regions the chlorophyll concentrations decrease
to values of 0.2 to 0.4 mg m
−3 as a result of low
nutrient availability, and the maximum chlorophyll
concentration occurs at a depth of 40 m. In the
southeastern corner of the Sea of Okhotsk chlorophyll
Paul A. TYLER
Fig. 9.14. Sea of Okhotsk. (a) Surface circulation. Redrawn from Tomczak and Godfrey (1994). (b) Distribution of potential temperature
and salinity in the World Ocean Circulation Experiment (WOCE) Section P1 (A–B). Redrawn from Freeland et al. (1998).
regions beginning at the ice edge. Over the deepwater regions the chlorophyll concentrations decrease
to values of 0.2 to 0.4 mg m
−3 as a result of low
nutrient availability, and the maximum chlorophyll
concentration occurs at a depth of 40 m. In the
southeastern corner of the Sea of Okhotsk chlorophyll