

THE POLAR DEEP SEAS
243
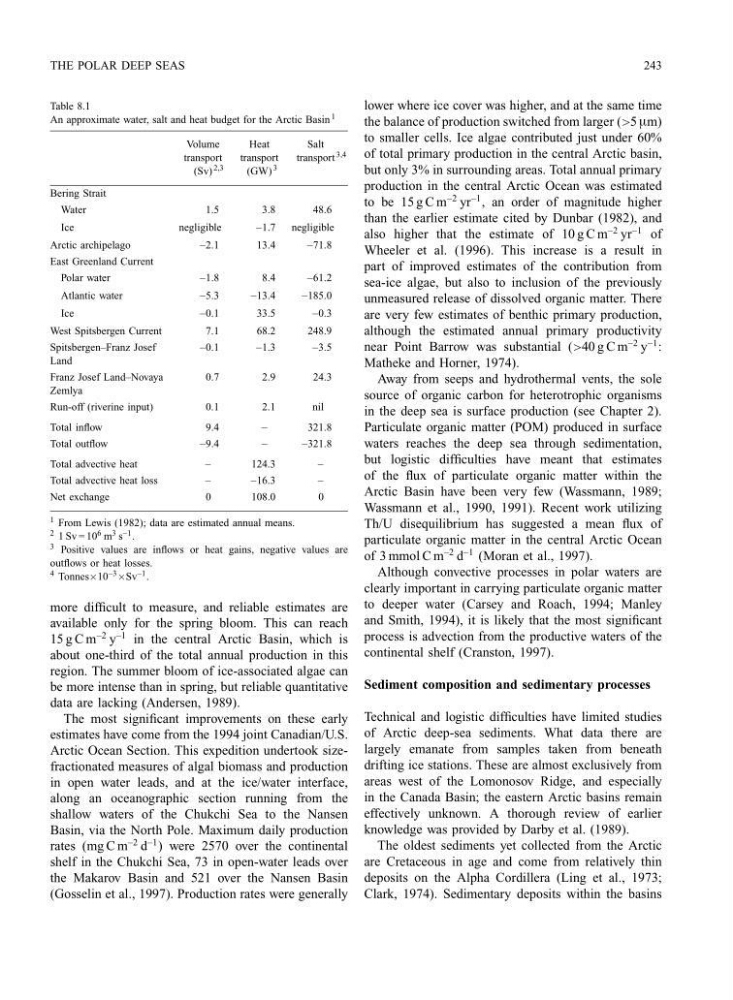
Table 8.1
An approximate water, salt and heat budget for the Arctic Basin 1
Volume
transport
(Sv) 2,3
Heat
transport
(GW) 3
Salt
transport 3,4
Bering Strait
Water
1.5
3.8
48.6
Ice
negligible
−1.7 negligible
Arctic archipelago
−2.1
13.4
−71.8
East Greenland Current
Polar water
−1.8
8.4
−61.2
Atlantic water
−5.3
−13.4
−185.0
Ice
−0.1
33.5
−0.3
West Spitsbergen Current
7.1
68.2
248.9
Spitsbergen–Franz Josef
Land
−0.1
−1.3
−3.5
Franz Josef Land–Novaya
Zemlya
0.7
2.9
24.3
Run-off (riverine input)
0.1
2.1
nil
Total inflow
9.4
−
321.8
Total outflow
−9.4
−
−321.8
Total advective heat
−
124.3
−
Total advective heat loss
−
−16.3
−
Net exchange
0
108.0
0
1 From Lewis (1982); data are estimated annual means.
2 1 Sv = 10 6 m 3 s −1 .
3 Positive values are inflows or heat gains, negative values are
outflows or heat losses.
4 Tonnes×10 −3 ×Sv −1 .
more difficult to measure, and reliable estimates are
available only for the spring bloom. This can reach
15 g C m
−2 y
−1 in the central Arctic Basin, which is
about one-third of the total annual production in this
region. The summer bloom of ice-associated algae can
be more intense than in spring, but reliable quantitative
data are lacking (Andersen, 1989).
The most significant improvements on these early
estimates have come from the 1994 joint Canadian/U.S.
Arctic Ocean Section. This expedition undertook sizefractionated measures of algal biomass and production
in open water leads, and at the ice/water interface,
along an oceanographic section running from the
shallow waters of the Chukchi Sea to the Nansen
Basin, via the North Pole. Maximum daily production
rates (mg C m
−2 d
−1 ) were 2570 over the continental
shelf in the Chukchi Sea, 73 in open-water leads over
the Makarov Basin and 521 over the Nansen Basin
(Gosselin et al., 1997). Production rates were generally
lower where ice cover was higher, and at the same time
the balance of production switched from larger (>5 mm)
to smaller cells. Ice algae contributed just under 60%
of total primary production in the central Arctic basin,
but only 3% in surrounding areas. Total annual primary
production in the central Arctic Ocean was estimated
to be 15 g C m
−2 yr
−1 , an order of magnitude higher
than the earlier estimate cited by Dunbar (1982), and
also higher that the estimate of 10 g C m
−2 yr
−1 of
Wheeler et al. (1996). This increase is a result in
part of improved estimates of the contribution from
sea-ice algae, but also to inclusion of the previously
unmeasured release of dissolved organic matter. There
are very few estimates of benthic primary production,
although the estimated annual primary productivity
near Point Barrow was substantial (>40 g C m
−2 y
−1 :
Matheke and Horner, 1974).
Away from seeps and hydrothermal vents, the sole
source of organic carbon for heterotrophic organisms
in the deep sea is surface production (see Chapter 2).
Particulate organic matter (POM) produced in surface
waters reaches the deep sea through sedimentation,
but logistic difficulties have meant that estimates
of the flux of particulate organic matter within the
Arctic Basin have been very few (Wassmann, 1989;
Wassmann et al., 1990, 1991). Recent work utilizing
Th/U disequilibrium has suggested a mean flux of
particulate organic matter in the central Arctic Ocean
of 3 mmol C m
−2 d
−1 (Moran et al., 1997).
Although convective processes in polar waters are
clearly important in carrying particulate organic matter
to deeper water (Carsey and Roach, 1994; Manley
and Smith, 1994), it is likely that the most significant
process is advection from the productive waters of the
continental shelf (Cranston, 1997).
Sediment composition and sedimentary processes
Technical and logistic difficulties have limited studies
of Arctic deep-sea sediments. What data there are
largely emanate from samples taken from beneath
drifting ice stations. These are almost exclusively from
areas west of the Lomonosov Ridge, and especially
in the Canada Basin; the eastern Arctic basins remain
effectively unknown. A thorough review of earlier
knowledge was provided by Darby et al. (1989).
The oldest sediments yet collected from the Arctic
are Cretaceous in age and come from relatively thin
deposits on the Alpha Cordillera (Ling et al., 1973;
Clark, 1974). Sedimentary deposits within the basins
243
Table 8.1
An approximate water, salt and heat budget for the Arctic Basin 1
Volume
transport
(Sv) 2,3
Heat
transport
(GW) 3
Salt
transport 3,4
Bering Strait
Water
1.5
3.8
48.6
Ice
negligible
−1.7 negligible
Arctic archipelago
−2.1
13.4
−71.8
East Greenland Current
Polar water
−1.8
8.4
−61.2
Atlantic water
−5.3
−13.4
−185.0
Ice
−0.1
33.5
−0.3
West Spitsbergen Current
7.1
68.2
248.9
Spitsbergen–Franz Josef
Land
−0.1
−1.3
−3.5
Franz Josef Land–Novaya
Zemlya
0.7
2.9
24.3
Run-off (riverine input)
0.1
2.1
nil
Total inflow
9.4
−
321.8
Total outflow
−9.4
−
−321.8
Total advective heat
−
124.3
−
Total advective heat loss
−
−16.3
−
Net exchange
0
108.0
0
1 From Lewis (1982); data are estimated annual means.
2 1 Sv = 10 6 m 3 s −1 .
3 Positive values are inflows or heat gains, negative values are
outflows or heat losses.
4 Tonnes×10 −3 ×Sv −1 .
more difficult to measure, and reliable estimates are
available only for the spring bloom. This can reach
15 g C m
−2 y
−1 in the central Arctic Basin, which is
about one-third of the total annual production in this
region. The summer bloom of ice-associated algae can
be more intense than in spring, but reliable quantitative
data are lacking (Andersen, 1989).
The most significant improvements on these early
estimates have come from the 1994 joint Canadian/U.S.
Arctic Ocean Section. This expedition undertook sizefractionated measures of algal biomass and production
in open water leads, and at the ice/water interface,
along an oceanographic section running from the
shallow waters of the Chukchi Sea to the Nansen
Basin, via the North Pole. Maximum daily production
rates (mg C m
−2 d
−1 ) were 2570 over the continental
shelf in the Chukchi Sea, 73 in open-water leads over
the Makarov Basin and 521 over the Nansen Basin
(Gosselin et al., 1997). Production rates were generally
lower where ice cover was higher, and at the same time
the balance of production switched from larger (>5 mm)
to smaller cells. Ice algae contributed just under 60%
of total primary production in the central Arctic basin,
but only 3% in surrounding areas. Total annual primary
production in the central Arctic Ocean was estimated
to be 15 g C m
−2 yr
−1 , an order of magnitude higher
than the earlier estimate cited by Dunbar (1982), and
also higher that the estimate of 10 g C m
−2 yr
−1 of
Wheeler et al. (1996). This increase is a result in
part of improved estimates of the contribution from
sea-ice algae, but also to inclusion of the previously
unmeasured release of dissolved organic matter. There
are very few estimates of benthic primary production,
although the estimated annual primary productivity
near Point Barrow was substantial (>40 g C m
−2 y
−1 :
Matheke and Horner, 1974).
Away from seeps and hydrothermal vents, the sole
source of organic carbon for heterotrophic organisms
in the deep sea is surface production (see Chapter 2).
Particulate organic matter (POM) produced in surface
waters reaches the deep sea through sedimentation,
but logistic difficulties have meant that estimates
of the flux of particulate organic matter within the
Arctic Basin have been very few (Wassmann, 1989;
Wassmann et al., 1990, 1991). Recent work utilizing
Th/U disequilibrium has suggested a mean flux of
particulate organic matter in the central Arctic Ocean
of 3 mmol C m
−2 d
−1 (Moran et al., 1997).
Although convective processes in polar waters are
clearly important in carrying particulate organic matter
to deeper water (Carsey and Roach, 1994; Manley
and Smith, 1994), it is likely that the most significant
process is advection from the productive waters of the
continental shelf (Cranston, 1997).
Sediment composition and sedimentary processes
Technical and logistic difficulties have limited studies
of Arctic deep-sea sediments. What data there are
largely emanate from samples taken from beneath
drifting ice stations. These are almost exclusively from
areas west of the Lomonosov Ridge, and especially
in the Canada Basin; the eastern Arctic basins remain
effectively unknown. A thorough review of earlier
knowledge was provided by Darby et al. (1989).
The oldest sediments yet collected from the Arctic
are Cretaceous in age and come from relatively thin
deposits on the Alpha Cordillera (Ling et al., 1973;
Clark, 1974). Sedimentary deposits within the basins