

THE DEEP INDIAN OCEAN FLOOR
227
(500 m) to 4.9 g C m
−2 (1000 m) (Duineveld et al.,
1997). The meiofauna (animals retained on a 32 mm
sieve) follow the same spatial patterns as the macrobenthos, with densities ranging from 806 individuals m
−2
(500 m) to 223 individuals m
−2 (1000 m). Nematodes
are the dominant taxon among the meiofauna, but
foraminifera are also present, especially branching
forms (Duineveld et al., 1997).
Carbon sources and trophic types
The Kenya shelf lacks the pulses in primary productivity driven by upwelling (Feldman, 1989), and
thus this area has a low rate of primary production,
ranging from 109.5 to 182.5 g C m
−2 y
−1 (Kromkamp
et al., 1997). The concentration of organic carbon
in the sediment is 0.4 to 1.6% and concentrations
of organic nitrogen range from 0.05 to 0.2% (Everaarts and Nieuwenhuize, 1995). Most of the organic matter present in the sediments originates from
pelagic production (Duineveld et al., 1997; Kromkamp
et al., 1997). Sediment pigment concentrations decrease
downslope along the Kenyan margin (Duineveld et al.,
1997), suggesting that benthic faunal distribution may
be influenced by the concentration of organic matter in
the sediment and/or the flux of organic matter to the
seafloor.
Rates of key ecological processes
In order to understand the biological and chemical
processes of benthic communities, it is important to
estimate rates of key ecological processes including
respiration, production, bioturbation, and recolonization following disturbance. On the Kenyan slope, crossshelf and downslope transport of particulate organic
carbon (POC) adds to the flux of sinking particles on
the slope (Duineveld et al., 1997). These processes
supplying organic matter to the seafloor are tightly
coupled with benthic metabolism (Duineveld et al.,
1997). On the Kenyan margin, oxygen consumption
by the sediment community (SCOC) ranges from
1 to 14.2 mmol m
−2 d
−1 , decreasing with increasing
water depth down to 1000 m. In addition, there appears
to be little temporal variation in the rate of oxygen
consumption from June to December.
Oxygen minimum zones
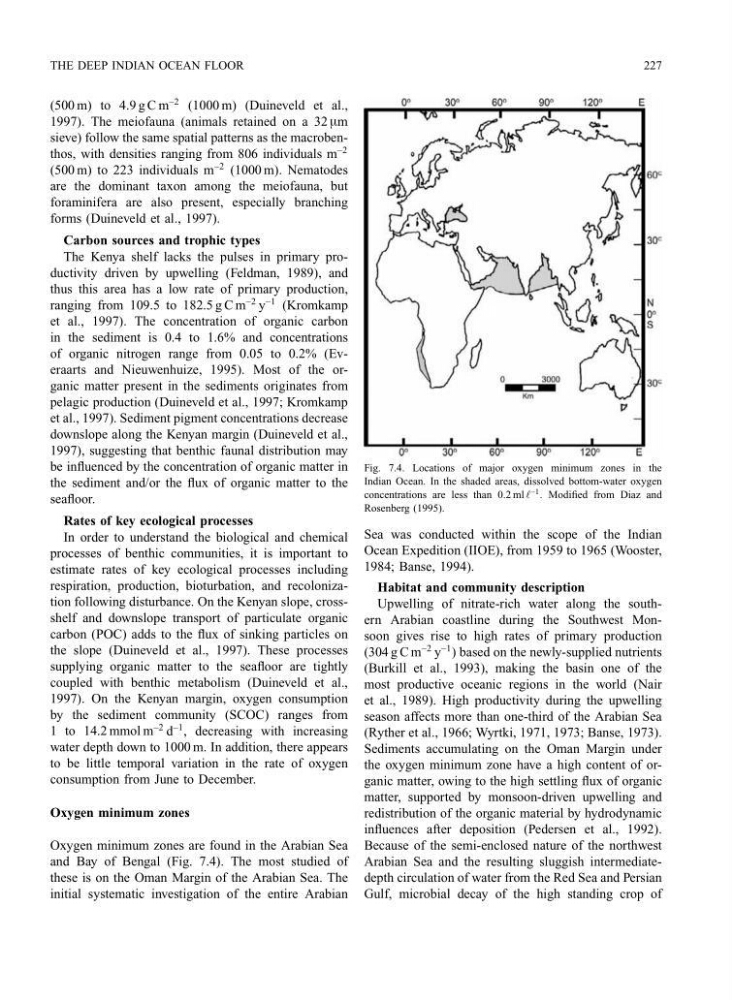
Oxygen minimum zones are found in the Arabian Sea
and Bay of Bengal (Fig. 7.4). The most studied of
these is on the Oman Margin of the Arabian Sea. The
initial systematic investigation of the entire Arabian
Fig. 7.4. Locations of major oxygen minimum zones in the
Indian Ocean. In the shaded areas, dissolved bottom-water oxygen
concentrations are less than 0.2 ml ° −1 . Modified from Diaz and
Rosenberg (1995).
Sea was conducted within the scope of the Indian
Ocean Expedition (IIOE), from 1959 to 1965 (Wooster,
1984; Banse, 1994).
Habitat and community description
Upwelling of nitrate-rich water along the southern Arabian coastline during the Southwest Monsoon gives rise to high rates of primary production
(304 g C m
−2 y
−1 ) based on the newly-supplied nutrients
(Burkill et al., 1993), making the basin one of the
most productive oceanic regions in the world (Nair
et al., 1989). High productivity during the upwelling
season affects more than one-third of the Arabian Sea
(Ryther et al., 1966; Wyrtki, 1971, 1973; Banse, 1973).
Sediments accumulating on the Oman Margin under
the oxygen minimum zone have a high content of organic matter, owing to the high settling flux of organic
matter, supported by monsoon-driven upwelling and
redistribution of the organic material by hydrodynamic
influences after deposition (Pedersen et al., 1992).
Because of the semi-enclosed nature of the northwest
Arabian Sea and the resulting sluggish intermediatedepth circulation of water from the Red Sea and Persian
Gulf, microbial decay of the high standing crop of
227
(500 m) to 4.9 g C m
−2 (1000 m) (Duineveld et al.,
1997). The meiofauna (animals retained on a 32 mm
sieve) follow the same spatial patterns as the macrobenthos, with densities ranging from 806 individuals m
−2
(500 m) to 223 individuals m
−2 (1000 m). Nematodes
are the dominant taxon among the meiofauna, but
foraminifera are also present, especially branching
forms (Duineveld et al., 1997).
Carbon sources and trophic types
The Kenya shelf lacks the pulses in primary productivity driven by upwelling (Feldman, 1989), and
thus this area has a low rate of primary production,
ranging from 109.5 to 182.5 g C m
−2 y
−1 (Kromkamp
et al., 1997). The concentration of organic carbon
in the sediment is 0.4 to 1.6% and concentrations
of organic nitrogen range from 0.05 to 0.2% (Everaarts and Nieuwenhuize, 1995). Most of the organic matter present in the sediments originates from
pelagic production (Duineveld et al., 1997; Kromkamp
et al., 1997). Sediment pigment concentrations decrease
downslope along the Kenyan margin (Duineveld et al.,
1997), suggesting that benthic faunal distribution may
be influenced by the concentration of organic matter in
the sediment and/or the flux of organic matter to the
seafloor.
Rates of key ecological processes
In order to understand the biological and chemical
processes of benthic communities, it is important to
estimate rates of key ecological processes including
respiration, production, bioturbation, and recolonization following disturbance. On the Kenyan slope, crossshelf and downslope transport of particulate organic
carbon (POC) adds to the flux of sinking particles on
the slope (Duineveld et al., 1997). These processes
supplying organic matter to the seafloor are tightly
coupled with benthic metabolism (Duineveld et al.,
1997). On the Kenyan margin, oxygen consumption
by the sediment community (SCOC) ranges from
1 to 14.2 mmol m
−2 d
−1 , decreasing with increasing
water depth down to 1000 m. In addition, there appears
to be little temporal variation in the rate of oxygen
consumption from June to December.
Oxygen minimum zones
Oxygen minimum zones are found in the Arabian Sea
and Bay of Bengal (Fig. 7.4). The most studied of
these is on the Oman Margin of the Arabian Sea. The
initial systematic investigation of the entire Arabian
Fig. 7.4. Locations of major oxygen minimum zones in the
Indian Ocean. In the shaded areas, dissolved bottom-water oxygen
concentrations are less than 0.2 ml ° −1 . Modified from Diaz and
Rosenberg (1995).
Sea was conducted within the scope of the Indian
Ocean Expedition (IIOE), from 1959 to 1965 (Wooster,
1984; Banse, 1994).
Habitat and community description
Upwelling of nitrate-rich water along the southern Arabian coastline during the Southwest Monsoon gives rise to high rates of primary production
(304 g C m
−2 y
−1 ) based on the newly-supplied nutrients
(Burkill et al., 1993), making the basin one of the
most productive oceanic regions in the world (Nair
et al., 1989). High productivity during the upwelling
season affects more than one-third of the Arabian Sea
(Ryther et al., 1966; Wyrtki, 1971, 1973; Banse, 1973).
Sediments accumulating on the Oman Margin under
the oxygen minimum zone have a high content of organic matter, owing to the high settling flux of organic
matter, supported by monsoon-driven upwelling and
redistribution of the organic material by hydrodynamic
influences after deposition (Pedersen et al., 1992).
Because of the semi-enclosed nature of the northwest
Arabian Sea and the resulting sluggish intermediatedepth circulation of water from the Red Sea and Persian
Gulf, microbial decay of the high standing crop of