

THE DEEP PACIFIC OCEAN FLOOR
201
with soft sediments (Fig. 6.6). In fact, the areas
of maximum commercial interest for nodule mining
fall in the mesotrophic abyss at roughly 10º to 20º
north or south of the equator (Fig. 6.1). As on
continental margins, the sedimented seafloor in the
equatorial abyss is heavily modified by the activities of
animals. Between 5ºS and 5ºN, the predominant visible
structures are the decimeter-wide tracks of burrowing
sea urchins that cover 10 to 18% of the seafloor, fecal
mounds 5 cm in diameter or more which cover ~0.5%
of the seafloor, the tests of xenophyophores (giant,
agglutinating protozoans ranging 3 to 10 cm in width),
and spoke-like feeding traces of echiurans and other
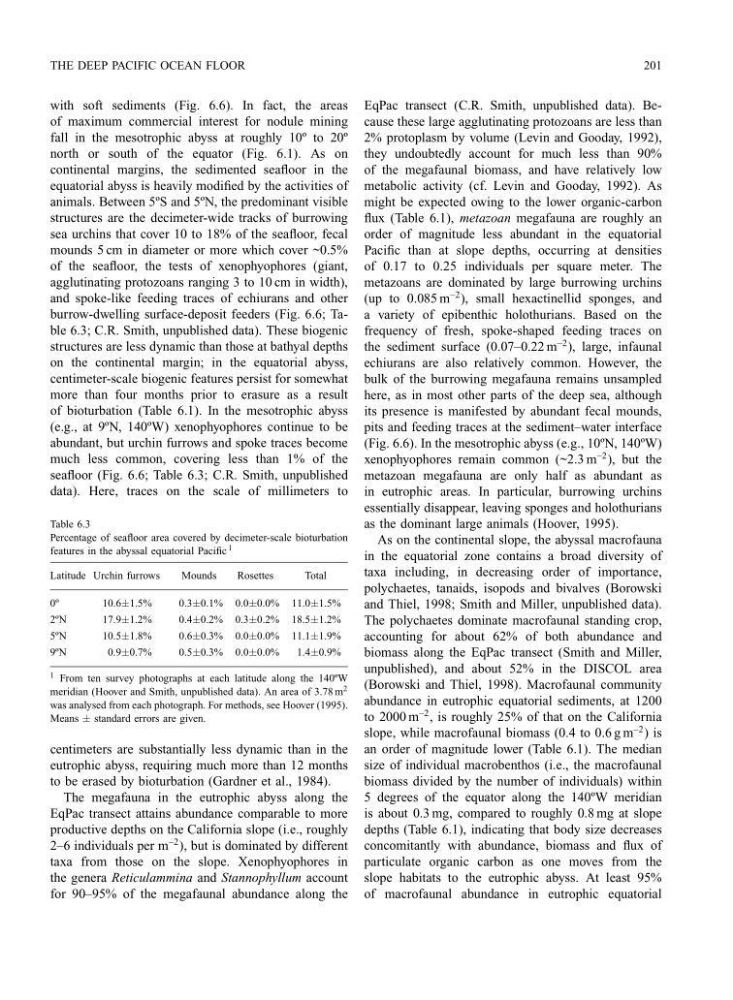
burrow-dwelling surface-deposit feeders (Fig. 6.6; Table 6.3; C.R. Smith, unpublished data). These biogenic
structures are less dynamic than those at bathyal depths
on the continental margin; in the equatorial abyss,
centimeter-scale biogenic features persist for somewhat
more than four months prior to erasure as a result
of bioturbation (Table 6.1). In the mesotrophic abyss
(e.g., at 9ºN, 140ºW) xenophyophores continue to be
abundant, but urchin furrows and spoke traces become
much less common, covering less than 1% of the
seafloor (Fig. 6.6; Table 6.3; C.R. Smith, unpublished
data). Here, traces on the scale of millimeters to
Table 6.3
Percentage of seafloor area covered by decimeter-scale bioturbation
features in the abyssal equatorial Pacific 1
Latitude Urchin furrows
Mounds
Rosettes
Total
0º
10.6±1.5%
0.3±0.1% 0.0±0.0% 11.0±1.5%
2ºN
17.9±1.2%
0.4±0.2% 0.3±0.2% 18.5±1.2%
5ºN
10.5±1.8%
0.6±0.3% 0.0±0.0% 11.1±1.9%
9ºN
0.9±0.7%
0.5±0.3% 0.0±0.0%
1.4±0.9%
1 From ten survey photographs at each latitude along the 140ºW
meridian (Hoover and Smith, unpublished data). An area of 3.78 m 2
was analysed from each photograph. For methods, see Hoover (1995).
Means ± standard errors are given.
centimeters are substantially less dynamic than in the
eutrophic abyss, requiring much more than 12 months
to be erased by bioturbation (Gardner et al., 1984).
The megafauna in the eutrophic abyss along the
EqPac transect attains abundance comparable to more
productive depths on the California slope (i.e., roughly
2–6 individuals per m
−2 ), but is dominated by different
taxa from those on the slope. Xenophyophores in
the genera Reticulammina and Stannophyllum account
for 90–95% of the megafaunal abundance along the
EqPac transect (C.R. Smith, unpublished data). Because these large agglutinating protozoans are less than
2% protoplasm by volume (Levin and Gooday, 1992),
they undoubtedly account for much less than 90%
of the megafaunal biomass, and have relatively low
metabolic activity (cf. Levin and Gooday, 1992). As
might be expected owing to the lower organic-carbon
flux (Table 6.1), metazoan megafauna are roughly an
order of magnitude less abundant in the equatorial
Pacific than at slope depths, occurring at densities
of 0.17 to 0.25 individuals per square meter. The
metazoans are dominated by large burrowing urchins
(up to 0.085 m
−2 ), small hexactinellid sponges, and
a variety of epibenthic holothurians. Based on the
frequency of fresh, spoke-shaped feeding traces on
the sediment surface (0.07–0.22 m
−2 ), large, infaunal
echiurans are also relatively common. However, the
bulk of the burrowing megafauna remains unsampled
here, as in most other parts of the deep sea, although
its presence is manifested by abundant fecal mounds,
pits and feeding traces at the sediment–water interface
(Fig. 6.6). In the mesotrophic abyss (e.g., 10ºN, 140ºW)
xenophyophores remain common (~2.3 m
−2 ), but the
metazoan megafauna are only half as abundant as
in eutrophic areas. In particular, burrowing urchins
essentially disappear, leaving sponges and holothurians
as the dominant large animals (Hoover, 1995).
As on the continental slope, the abyssal macrofauna
in the equatorial zone contains a broad diversity of
taxa including, in decreasing order of importance,
polychaetes, tanaids, isopods and bivalves (Borowski
and Thiel, 1998; Smith and Miller, unpublished data).
The polychaetes dominate macrofaunal standing crop,
accounting for about 62% of both abundance and
biomass along the EqPac transect (Smith and Miller,
unpublished), and about 52% in the DISCOL area
(Borowski and Thiel, 1998). Macrofaunal community
abundance in eutrophic equatorial sediments, at 1200
to 2000 m
−2 , is roughly 25% of that on the California
slope, while macrofaunal biomass (0.4 to 0.6 g m
−2 ) is
an order of magnitude lower (Table 6.1). The median
size of individual macrobenthos (i.e., the macrofaunal
biomass divided by the number of individuals) within
5 degrees of the equator along the 140ºW meridian
is about 0.3 mg, compared to roughly 0.8 mg at slope
depths (Table 6.1), indicating that body size decreases
concomitantly with abundance, biomass and flux of
particulate organic carbon as one moves from the
slope habitats to the eutrophic abyss. At least 95%
of macrofaunal abundance in eutrophic equatorial
201
with soft sediments (Fig. 6.6). In fact, the areas
of maximum commercial interest for nodule mining
fall in the mesotrophic abyss at roughly 10º to 20º
north or south of the equator (Fig. 6.1). As on
continental margins, the sedimented seafloor in the
equatorial abyss is heavily modified by the activities of
animals. Between 5ºS and 5ºN, the predominant visible
structures are the decimeter-wide tracks of burrowing
sea urchins that cover 10 to 18% of the seafloor, fecal
mounds 5 cm in diameter or more which cover ~0.5%
of the seafloor, the tests of xenophyophores (giant,
agglutinating protozoans ranging 3 to 10 cm in width),
and spoke-like feeding traces of echiurans and other
burrow-dwelling surface-deposit feeders (Fig. 6.6; Table 6.3; C.R. Smith, unpublished data). These biogenic
structures are less dynamic than those at bathyal depths
on the continental margin; in the equatorial abyss,
centimeter-scale biogenic features persist for somewhat
more than four months prior to erasure as a result
of bioturbation (Table 6.1). In the mesotrophic abyss
(e.g., at 9ºN, 140ºW) xenophyophores continue to be
abundant, but urchin furrows and spoke traces become
much less common, covering less than 1% of the
seafloor (Fig. 6.6; Table 6.3; C.R. Smith, unpublished
data). Here, traces on the scale of millimeters to
Table 6.3
Percentage of seafloor area covered by decimeter-scale bioturbation
features in the abyssal equatorial Pacific 1
Latitude Urchin furrows
Mounds
Rosettes
Total
0º
10.6±1.5%
0.3±0.1% 0.0±0.0% 11.0±1.5%
2ºN
17.9±1.2%
0.4±0.2% 0.3±0.2% 18.5±1.2%
5ºN
10.5±1.8%
0.6±0.3% 0.0±0.0% 11.1±1.9%
9ºN
0.9±0.7%
0.5±0.3% 0.0±0.0%
1.4±0.9%
1 From ten survey photographs at each latitude along the 140ºW
meridian (Hoover and Smith, unpublished data). An area of 3.78 m 2
was analysed from each photograph. For methods, see Hoover (1995).
Means ± standard errors are given.
centimeters are substantially less dynamic than in the
eutrophic abyss, requiring much more than 12 months
to be erased by bioturbation (Gardner et al., 1984).
The megafauna in the eutrophic abyss along the
EqPac transect attains abundance comparable to more
productive depths on the California slope (i.e., roughly
2–6 individuals per m
−2 ), but is dominated by different
taxa from those on the slope. Xenophyophores in
the genera Reticulammina and Stannophyllum account
for 90–95% of the megafaunal abundance along the
EqPac transect (C.R. Smith, unpublished data). Because these large agglutinating protozoans are less than
2% protoplasm by volume (Levin and Gooday, 1992),
they undoubtedly account for much less than 90%
of the megafaunal biomass, and have relatively low
metabolic activity (cf. Levin and Gooday, 1992). As
might be expected owing to the lower organic-carbon
flux (Table 6.1), metazoan megafauna are roughly an
order of magnitude less abundant in the equatorial
Pacific than at slope depths, occurring at densities
of 0.17 to 0.25 individuals per square meter. The
metazoans are dominated by large burrowing urchins
(up to 0.085 m
−2 ), small hexactinellid sponges, and
a variety of epibenthic holothurians. Based on the
frequency of fresh, spoke-shaped feeding traces on
the sediment surface (0.07–0.22 m
−2 ), large, infaunal
echiurans are also relatively common. However, the
bulk of the burrowing megafauna remains unsampled
here, as in most other parts of the deep sea, although
its presence is manifested by abundant fecal mounds,
pits and feeding traces at the sediment–water interface
(Fig. 6.6). In the mesotrophic abyss (e.g., 10ºN, 140ºW)
xenophyophores remain common (~2.3 m
−2 ), but the
metazoan megafauna are only half as abundant as
in eutrophic areas. In particular, burrowing urchins
essentially disappear, leaving sponges and holothurians
as the dominant large animals (Hoover, 1995).
As on the continental slope, the abyssal macrofauna
in the equatorial zone contains a broad diversity of
taxa including, in decreasing order of importance,
polychaetes, tanaids, isopods and bivalves (Borowski
and Thiel, 1998; Smith and Miller, unpublished data).
The polychaetes dominate macrofaunal standing crop,
accounting for about 62% of both abundance and
biomass along the EqPac transect (Smith and Miller,
unpublished), and about 52% in the DISCOL area
(Borowski and Thiel, 1998). Macrofaunal community
abundance in eutrophic equatorial sediments, at 1200
to 2000 m
−2 , is roughly 25% of that on the California
slope, while macrofaunal biomass (0.4 to 0.6 g m
−2 ) is
an order of magnitude lower (Table 6.1). The median
size of individual macrobenthos (i.e., the macrofaunal
biomass divided by the number of individuals) within
5 degrees of the equator along the 140ºW meridian
is about 0.3 mg, compared to roughly 0.8 mg at slope
depths (Table 6.1), indicating that body size decreases
concomitantly with abundance, biomass and flux of
particulate organic carbon as one moves from the
slope habitats to the eutrophic abyss. At least 95%
of macrofaunal abundance in eutrophic equatorial