

Résumé
182
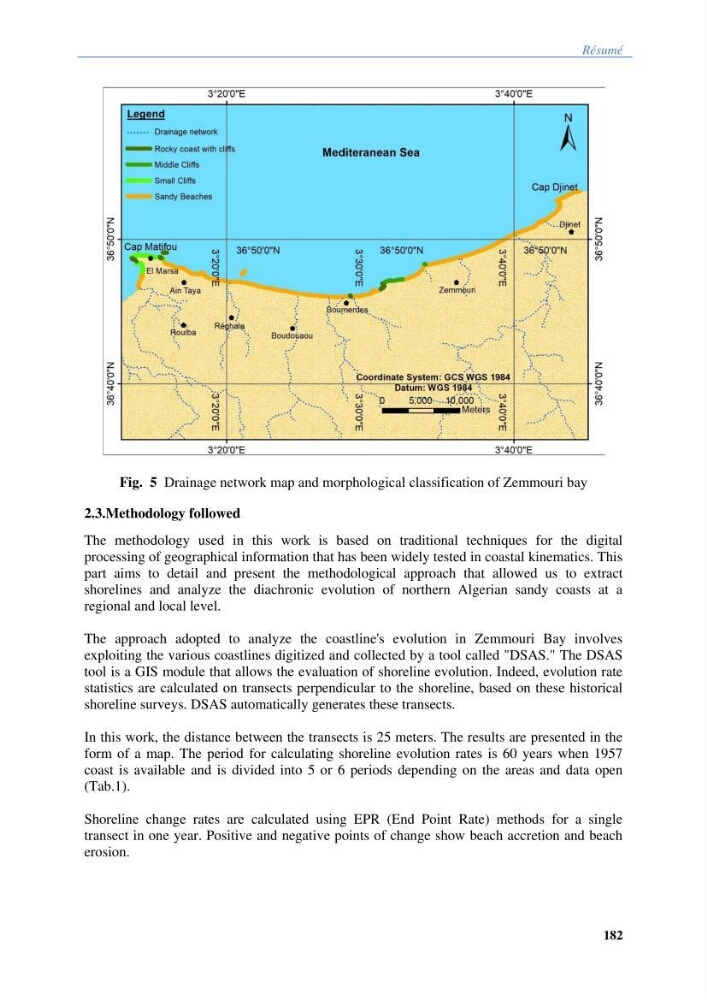
Fig. 5 Drainage network map and morphological classification of Zemmouri bay
2.3.Methodology followed
The methodology used in this work is based on traditional techniques for the digital
processing of geographical information that has been widely tested in coastal kinematics. This
part aims to detail and present the methodological approach that allowed us to extract
shorelines and analyze the diachronic evolution of northern Algerian sandy coasts at a
regional and local level.
The approach adopted to analyze the coastline's evolution in Zemmouri Bay involves
exploiting the various coastlines digitized and collected by a tool called "DSAS." The DSAS
tool is a GIS module that allows the evaluation of shoreline evolution. Indeed, evolution rate
statistics are calculated on transects perpendicular to the shoreline, based on these historical
shoreline surveys. DSAS automatically generates these transects.
In this work, the distance between the transects is 25 meters. The results are presented in the
form of a map. The period for calculating shoreline evolution rates is 60 years when 1957
coast is available and is divided into 5 or 6 periods depending on the areas and data open
(Tab.1).
Shoreline change rates are calculated using EPR (End Point Rate) methods for a single
transect in one year. Positive and negative points of change show beach accretion and beach
erosion.
182
Fig. 5 Drainage network map and morphological classification of Zemmouri bay
2.3.Methodology followed
The methodology used in this work is based on traditional techniques for the digital
processing of geographical information that has been widely tested in coastal kinematics. This
part aims to detail and present the methodological approach that allowed us to extract
shorelines and analyze the diachronic evolution of northern Algerian sandy coasts at a
regional and local level.
The approach adopted to analyze the coastline's evolution in Zemmouri Bay involves
exploiting the various coastlines digitized and collected by a tool called "DSAS." The DSAS
tool is a GIS module that allows the evaluation of shoreline evolution. Indeed, evolution rate
statistics are calculated on transects perpendicular to the shoreline, based on these historical
shoreline surveys. DSAS automatically generates these transects.
In this work, the distance between the transects is 25 meters. The results are presented in the
form of a map. The period for calculating shoreline evolution rates is 60 years when 1957
coast is available and is divided into 5 or 6 periods depending on the areas and data open
(Tab.1).
Shoreline change rates are calculated using EPR (End Point Rate) methods for a single
transect in one year. Positive and negative points of change show beach accretion and beach
erosion.