

Biochemical Systematics and Ecology 96 (2021) 104262
4
TSC(mg.g
− 1 ) =
mg Tsap
g starfish powder
(1)
Saponin concentrations have been expressed as means ± standard
deviation (SD). The Data obtained was statistically assessed by ANOVA
and Tukey’s post hoc test for means discrimination (95% confidence
level). The difference in saponins amounts was taken significant and at
p < 0.05. The Minitab software was used to analyze all the results.
3. Results and discussion
3.1. Qualitative study
3.1.1. HR-ESI-MS analysis
HR-ESI-MS technique was used for direct detection and analysis of
saponin mixtures. The major peaks in mass spectra were in accordance
in ESI (+) ionization mode with [M+Na]
+
ions which makes them easier
to analyze. The full-scan HR-ESI-MS mass spectrum of the saponins
extract obtained from different organs of E. sepositus showed intense
signals in the m/z 800–1000 range and corresponding potentially to
ionized saponins. As a typical example, the ESI mass spectrum of the
saponin extract obtained from the oral body wall of female’s individuals
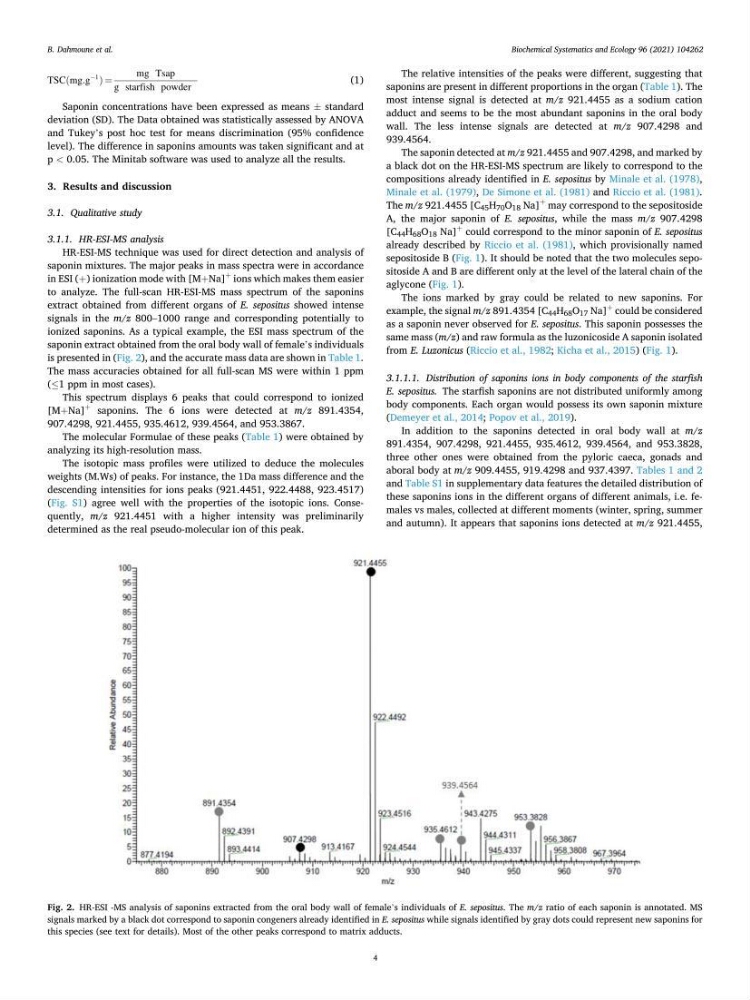
is presented in (Fig. 2), and the accurate mass data are shown in Table 1.
The mass accuracies obtained for all full-scan MS were within 1 ppm
(≤1 ppm in most cases).
This spectrum displays 6 peaks that could correspond to ionized
[M+Na]
+
saponins. The 6 ions were detected at m/z 891.4354,
907.4298, 921.4455, 935.4612, 939.4564, and 953.3867.
The molecular Formulae of these peaks (Table 1) were obtained by
analyzing its high-resolution mass.
The isotopic mass profiles were utilized to deduce the molecules
weights (M.Ws) of peaks. For instance, the 1Da mass difference and the
descending intensities for ions peaks (921.4451, 922.4488, 923.4517)
(Fig. S1) agree well with the properties of the isotopic ions. Consequently, m/z 921.4451 with a higher intensity was preliminarily
determined as the real pseudo-molecular ion of this peak.
The relative intensities of the peaks were different, suggesting that
saponins are present in different proportions in the organ (Table 1). The
most intense signal is detected at m/z 921.4455 as a sodium cation
adduct and seems to be the most abundant saponins in the oral body
wall. The less intense signals are detected at m/z 907.4298 and
939.4564.
The saponin detected at m/z 921.4455 and 907.4298, and marked by
a black dot on the HR-ESI-MS spectrum are likely to correspond to the
compositions already identified in E. sepositus by Minale et al. (1978),
Minale et al. (1979), De Simone et al. (1981) and Riccio et al. (1981).
The m/z 921.4455 [C 45 H 70 O 18 Na]
+
may correspond to the sepositoside
A, the major saponin of E. sepositus, while the mass m/z 907.4298
[C 44 H 68 O 18 Na]
+
could correspond to the minor saponin of E. sepositus
already described by Riccio et al. (1981), which provisionally named
sepositoside B (Fig. 1). It should be noted that the two molecules sepositoside A and B are different only at the level of the lateral chain of the
aglycone (Fig. 1).
The ions marked by gray could be related to new saponins. For
example, the signal m/z 891.4354 [C 44 H 68 O 17 Na]
+
could be considered
as a saponin never observed for E. sepositus. This saponin possesses the
same mass (m/z) and raw formula as the luzonicoside A saponin isolated
from E. Luzonicus (Riccio et al., 1982; Kicha et al., 2015) (Fig. 1).
3.1.1.1. Distribution of saponins ions in body components of the starfish
E. sepositus. The starfish saponins are not distributed uniformly among
body components. Each organ would possess its own saponin mixture
(Demeyer et al., 2014; Popov et al., 2019).
In addition to the saponins detected in oral body wall at m/z
891.4354, 907.4298, 921.4455, 935.4612, 939.4564, and 953.3828,
three other ones were obtained from the pyloric caeca, gonads and
aboral body at m/z 909.4455, 919.4298 and 937.4397. Tables 1 and 2
and Table S1 in supplementary data features the detailed distribution of
these saponins ions in the different organs of different animals, i.e. females vs males, collected at different moments (winter, spring, summer
and autumn). It appears that saponins ions detected at m/z 921.4455,
Fig. 2. HR-ESI -MS analysis of saponins extracted from the oral body wall of female’s individuals of E. sepositus. The m/z ratio of each saponin is annotated. MS
signals marked by a black dot correspond to saponin congeners already identified in E. sepositus while signals identified by gray dots could represent new saponins for
this species (see text for details). Most of the other peaks correspond to matrix adducts.
B. Dahmoune et al.
4
TSC(mg.g
− 1 ) =
mg Tsap
g starfish powder
(1)
Saponin concentrations have been expressed as means ± standard
deviation (SD). The Data obtained was statistically assessed by ANOVA
and Tukey’s post hoc test for means discrimination (95% confidence
level). The difference in saponins amounts was taken significant and at
p < 0.05. The Minitab software was used to analyze all the results.
3. Results and discussion
3.1. Qualitative study
3.1.1. HR-ESI-MS analysis
HR-ESI-MS technique was used for direct detection and analysis of
saponin mixtures. The major peaks in mass spectra were in accordance
in ESI (+) ionization mode with [M+Na]
+
ions which makes them easier
to analyze. The full-scan HR-ESI-MS mass spectrum of the saponins
extract obtained from different organs of E. sepositus showed intense
signals in the m/z 800–1000 range and corresponding potentially to
ionized saponins. As a typical example, the ESI mass spectrum of the
saponin extract obtained from the oral body wall of female’s individuals
is presented in (Fig. 2), and the accurate mass data are shown in Table 1.
The mass accuracies obtained for all full-scan MS were within 1 ppm
(≤1 ppm in most cases).
This spectrum displays 6 peaks that could correspond to ionized
[M+Na]
+
saponins. The 6 ions were detected at m/z 891.4354,
907.4298, 921.4455, 935.4612, 939.4564, and 953.3867.
The molecular Formulae of these peaks (Table 1) were obtained by
analyzing its high-resolution mass.
The isotopic mass profiles were utilized to deduce the molecules
weights (M.Ws) of peaks. For instance, the 1Da mass difference and the
descending intensities for ions peaks (921.4451, 922.4488, 923.4517)
(Fig. S1) agree well with the properties of the isotopic ions. Consequently, m/z 921.4451 with a higher intensity was preliminarily
determined as the real pseudo-molecular ion of this peak.
The relative intensities of the peaks were different, suggesting that
saponins are present in different proportions in the organ (Table 1). The
most intense signal is detected at m/z 921.4455 as a sodium cation
adduct and seems to be the most abundant saponins in the oral body
wall. The less intense signals are detected at m/z 907.4298 and
939.4564.
The saponin detected at m/z 921.4455 and 907.4298, and marked by
a black dot on the HR-ESI-MS spectrum are likely to correspond to the
compositions already identified in E. sepositus by Minale et al. (1978),
Minale et al. (1979), De Simone et al. (1981) and Riccio et al. (1981).
The m/z 921.4455 [C 45 H 70 O 18 Na]
+
may correspond to the sepositoside
A, the major saponin of E. sepositus, while the mass m/z 907.4298
[C 44 H 68 O 18 Na]
+
could correspond to the minor saponin of E. sepositus
already described by Riccio et al. (1981), which provisionally named
sepositoside B (Fig. 1). It should be noted that the two molecules sepositoside A and B are different only at the level of the lateral chain of the
aglycone (Fig. 1).
The ions marked by gray could be related to new saponins. For
example, the signal m/z 891.4354 [C 44 H 68 O 17 Na]
+
could be considered
as a saponin never observed for E. sepositus. This saponin possesses the
same mass (m/z) and raw formula as the luzonicoside A saponin isolated
from E. Luzonicus (Riccio et al., 1982; Kicha et al., 2015) (Fig. 1).
3.1.1.1. Distribution of saponins ions in body components of the starfish
E. sepositus. The starfish saponins are not distributed uniformly among
body components. Each organ would possess its own saponin mixture
(Demeyer et al., 2014; Popov et al., 2019).
In addition to the saponins detected in oral body wall at m/z
891.4354, 907.4298, 921.4455, 935.4612, 939.4564, and 953.3828,
three other ones were obtained from the pyloric caeca, gonads and
aboral body at m/z 909.4455, 919.4298 and 937.4397. Tables 1 and 2
and Table S1 in supplementary data features the detailed distribution of
these saponins ions in the different organs of different animals, i.e. females vs males, collected at different moments (winter, spring, summer
and autumn). It appears that saponins ions detected at m/z 921.4455,
Fig. 2. HR-ESI -MS analysis of saponins extracted from the oral body wall of female’s individuals of E. sepositus. The m/z ratio of each saponin is annotated. MS
signals marked by a black dot correspond to saponin congeners already identified in E. sepositus while signals identified by gray dots could represent new saponins for
this species (see text for details). Most of the other peaks correspond to matrix adducts.
B. Dahmoune et al.