

Aquatic Organic Matter Fluorescence
79
Emission Wavelength (nm)
Excitation Wavelength (nm)
300
250
300
350
400
450
350
400
450
500
550
650
700
600
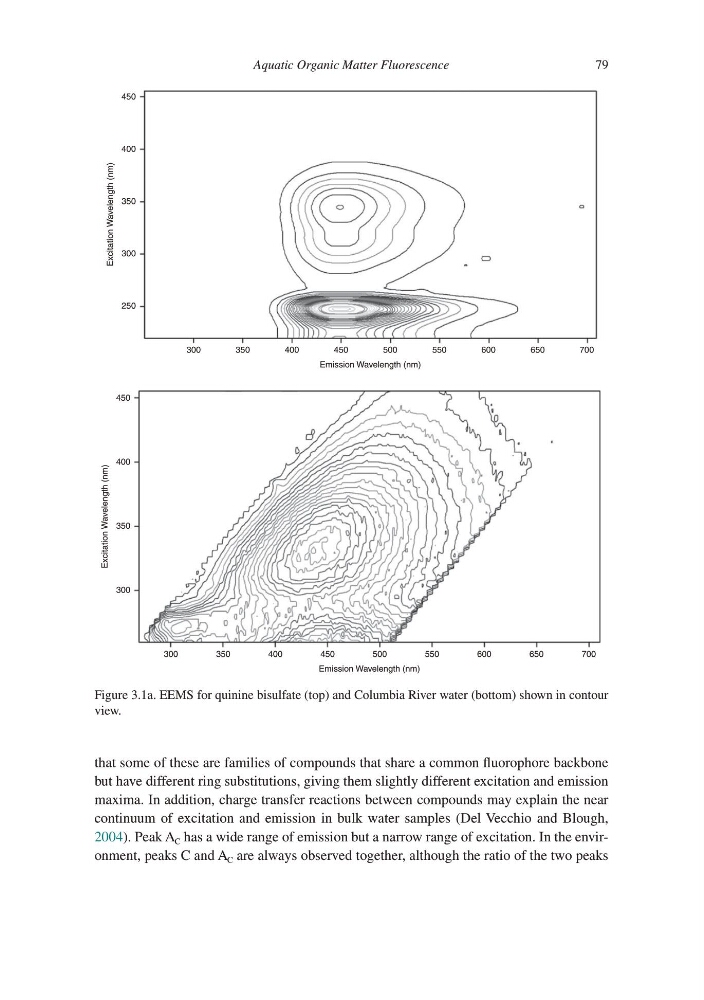
Figure 3.1a. EEMS for quinine bisulfate (top) and Columbia River water (bottom) shown in contour
view.
Emission Wavelength (nm)
Excitation Wavelength (nm)
300
300
350
400
450
350
400
450
500
550
650
700
600
that some of these are families of compounds that share a common fluorophore backbone
but have different ring substitutions, giving them slightly different excitation and emission
maxima. In addition, charge transfer reactions between compounds may explain the near
continuum of excitation and emission in bulk water samples (Del Vecchio and Blough,
2004). Peak A C has a wide range of emission but a narrow range of excitation. In the environment, peaks C and A C are always observed together, although the ratio of the two peaks
79
Emission Wavelength (nm)
Excitation Wavelength (nm)
300
250
300
350
400
450
350
400
450
500
550
650
700
600
Figure 3.1a. EEMS for quinine bisulfate (top) and Columbia River water (bottom) shown in contour
view.
Emission Wavelength (nm)
Excitation Wavelength (nm)
300
300
350
400
450
350
400
450
500
550
650
700
600
that some of these are families of compounds that share a common fluorophore backbone
but have different ring substitutions, giving them slightly different excitation and emission
maxima. In addition, charge transfer reactions between compounds may explain the near
continuum of excitation and emission in bulk water samples (Del Vecchio and Blough,
2004). Peak A C has a wide range of emission but a narrow range of excitation. In the environment, peaks C and A C are always observed together, although the ratio of the two peaks