

Coble, Spencer, Baker, and Reynolds
78
In samples containing only humic substances, two peaks are observed, one from excitation around 260 nm (peak A C, formerly peak A), and one from excitation around 340 nm
(peak C). Peak C shows elongated contours that result from a shift toward longer wavelength emission as excitation wavelength increases. This fluorescence response is typical
of aquatic humic substances and is attributed to several factors, perhaps the most important
of which is that CDOM is composed of a mixture of individual fluorophores. It is likely
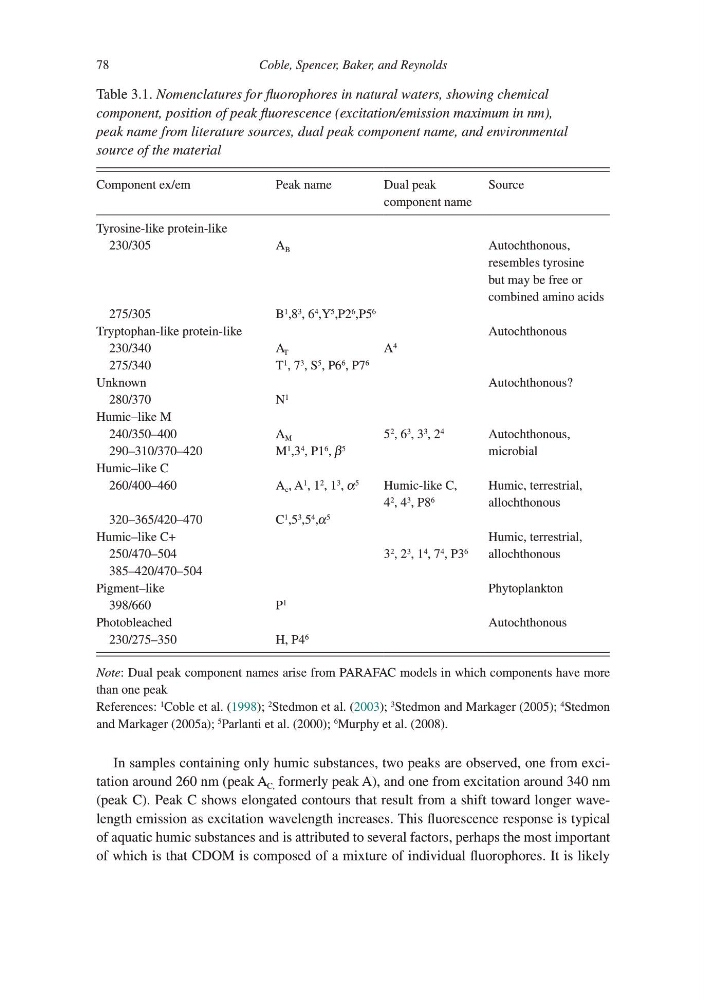
Table 3.1. Nomenclatures for fluorophores in natural waters, showing chemical
component, position of peak fluorescence (excitation/emission maximum in nm),
peak name from literature sources, dual peak component name, and environmental
source of the material
Component ex/em
Peak name
Dual peak
component name
Source
Tyrosine-like protein-like
230/305
A B
Autochthonous,
resembles tyrosine
but may be free or
combined amino acids
275/305
B
1
,8
3
, 6
4
,Y
5
,P2
6
,P5
6
Tryptophan-like protein-like
Autochthonous
230/340
A T
A
4
275/340
T
1
, 7
3
, S
5
, P6
6
, P7
6
Unknown
Autochthonous?
280/370
N
1
Humic–like M
Autochthonous,
microbial
240/350–400
A M
5
2
, 6
3
, 3
3
, 2
4
290–310/370–420
M
1
,3
4
, P1
6
, β
5
Humic–like C
Humic, terrestrial,
allochthonous
260/400–460
A c , A
1
, 1
2
, 1
3
, α
5
Humic-like C,
4
2
, 4
3
, P8
6
320–365/420–470
C
1
,5
3
,5
4
,α
5
Humic–like C+
Humic, terrestrial,
allochthonous
250/470–504
3
2
, 2
3
, 1
4
, 7
4
, P3
6
385–420/470–504
Pigment–like
Phytoplankton
398/660
P
1
Photobleached
Autochthonous
230/275–350
H, P4
6
Note: Dual peak component names arise from PARAFAC models in which components have more
than one peak
References:
1
Coble et al. (1998);
2
Stedmon et al. (2003);
3
Stedmon and Markager (2005);
4
Stedmon
and Markager (2005a);
5
Parlanti et al. (2000);
6
Murphy et al. (2008).
78
In samples containing only humic substances, two peaks are observed, one from excitation around 260 nm (peak A C, formerly peak A), and one from excitation around 340 nm
(peak C). Peak C shows elongated contours that result from a shift toward longer wavelength emission as excitation wavelength increases. This fluorescence response is typical
of aquatic humic substances and is attributed to several factors, perhaps the most important
of which is that CDOM is composed of a mixture of individual fluorophores. It is likely
Table 3.1. Nomenclatures for fluorophores in natural waters, showing chemical
component, position of peak fluorescence (excitation/emission maximum in nm),
peak name from literature sources, dual peak component name, and environmental
source of the material
Component ex/em
Peak name
Dual peak
component name
Source
Tyrosine-like protein-like
230/305
A B
Autochthonous,
resembles tyrosine
but may be free or
combined amino acids
275/305
B
1
,8
3
, 6
4
,Y
5
,P2
6
,P5
6
Tryptophan-like protein-like
Autochthonous
230/340
A T
A
4
275/340
T
1
, 7
3
, S
5
, P6
6
, P7
6
Unknown
Autochthonous?
280/370
N
1
Humic–like M
Autochthonous,
microbial
240/350–400
A M
5
2
, 6
3
, 3
3
, 2
4
290–310/370–420
M
1
,3
4
, P1
6
, β
5
Humic–like C
Humic, terrestrial,
allochthonous
260/400–460
A c , A
1
, 1
2
, 1
3
, α
5
Humic-like C,
4
2
, 4
3
, P8
6
320–365/420–470
C
1
,5
3
,5
4
,α
5
Humic–like C+
Humic, terrestrial,
allochthonous
250/470–504
3
2
, 2
3
, 1
4
, 7
4
, P3
6
385–420/470–504
Pigment–like
Phytoplankton
398/660
P
1
Photobleached
Autochthonous
230/275–350
H, P4
6
Note: Dual peak component names arise from PARAFAC models in which components have more
than one peak
References:
1
Coble et al. (1998);
2
Stedmon et al. (2003);
3
Stedmon and Markager (2005);
4
Stedmon
and Markager (2005a);
5
Parlanti et al. (2000);
6
Murphy et al. (2008).