

400
O
O
O
Gly
O
O
OH
OH
OH
OH
CH 3
CH 3
H or lignin
O
O
lignin
SH
H 3 C
H 3 C
HO
380
Excitation Wavelength, nm
360
340
320
300
280
260
300
350
400
450
500
550
600
240
400
380
360
340
320
300
280
260
300
350
400
450
500
550
600
300
350
400
450
Emission Wavelength, nm
500
550
600
240
(a)
400
380
Excitation Wavelength, nm
360
340
320
300
280
260
300
350
400
450
Emission Wavelength, nm
500
550
600
240
400
380
360
340
320
300
280
260
240
(b)
(c)
(d)
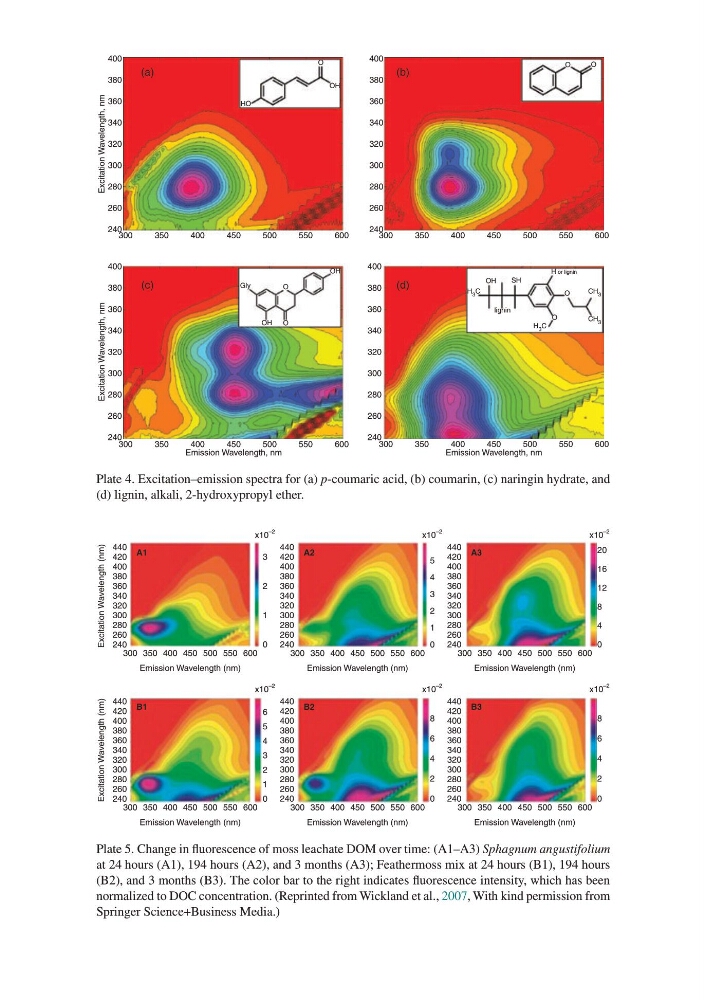
Plate 4. Excitation–emission spectra for (a) p-coumaric acid, (b) coumarin, (c) naringin hydrate, and
(d) lignin, alkali, 2-hydroxypropyl ether.
0
1
2
3
x10
–2
300 350 400 450 500 550 600
A1
Excitation Wavelength (nm)
Emission Wavelength (nm)
240
260
280
300
320
340
360
380
400
420
440
0
2
1
4
5
3
6
x10
–2
300 350 400 450 500 550 600
B1
Excitation Wavelength (nm)
Emission Wavelength (nm)
240
260
280
300
320
340
360
380
400
420
440
0
1
4
3
2
5
x10
–2
300 350 400 450 500 550 600
A2
Emission Wavelength (nm)
240
260
280
300
320
340
360
380
400
420
440
0
4
2
6
8
0
4
2
6
8
x10
–2
300 350 400 450 500 550 600
B2
Emission Wavelength (nm)
240
260
280
300
320
340
360
380
400
420
440
0
4
8
12
16
20
x10
–2
300 350 400 450 500 550 600
A3
Emission Wavelength (nm)
240
260
280
300
320
340
360
380
400
420
440
x10
–2
300 350 400 450 500 550 600
B3
Emission Wavelength (nm)
240
260
280
300
320
340
360
380
400
420
440
Plate 5. Change in fluorescence of moss leachate DOM over time: (A1–A3) Sphagnum angustifolium
at 24 hours (A1), 194 hours (A2), and 3 months (A3); Feathermoss mix at 24 hours (B1), 194 hours
(B2), and 3 months (B3). The color bar to the right indicates fluorescence intensity, which has been
normalized to DOC concentration. (Reprinted from Wickland et al., 2007, With kind permission from
Springer Science+Business Media.)
O
O
O
Gly
O
O
OH
OH
OH
OH
CH 3
CH 3
H or lignin
O
O
lignin
SH
H 3 C
H 3 C
HO
380
Excitation Wavelength, nm
360
340
320
300
280
260
300
350
400
450
500
550
600
240
400
380
360
340
320
300
280
260
300
350
400
450
500
550
600
300
350
400
450
Emission Wavelength, nm
500
550
600
240
(a)
400
380
Excitation Wavelength, nm
360
340
320
300
280
260
300
350
400
450
Emission Wavelength, nm
500
550
600
240
400
380
360
340
320
300
280
260
240
(b)
(c)
(d)
Plate 4. Excitation–emission spectra for (a) p-coumaric acid, (b) coumarin, (c) naringin hydrate, and
(d) lignin, alkali, 2-hydroxypropyl ether.
0
1
2
3
x10
–2
300 350 400 450 500 550 600
A1
Excitation Wavelength (nm)
Emission Wavelength (nm)
240
260
280
300
320
340
360
380
400
420
440
0
2
1
4
5
3
6
x10
–2
300 350 400 450 500 550 600
B1
Excitation Wavelength (nm)
Emission Wavelength (nm)
240
260
280
300
320
340
360
380
400
420
440
0
1
4
3
2
5
x10
–2
300 350 400 450 500 550 600
A2
Emission Wavelength (nm)
240
260
280
300
320
340
360
380
400
420
440
0
4
2
6
8
0
4
2
6
8
x10
–2
300 350 400 450 500 550 600
B2
Emission Wavelength (nm)
240
260
280
300
320
340
360
380
400
420
440
0
4
8
12
16
20
x10
–2
300 350 400 450 500 550 600
A3
Emission Wavelength (nm)
240
260
280
300
320
340
360
380
400
420
440
x10
–2
300 350 400 450 500 550 600
B3
Emission Wavelength (nm)
240
260
280
300
320
340
360
380
400
420
440
Plate 5. Change in fluorescence of moss leachate DOM over time: (A1–A3) Sphagnum angustifolium
at 24 hours (A1), 194 hours (A2), and 3 months (A3); Feathermoss mix at 24 hours (B1), 194 hours
(B2), and 3 months (B3). The color bar to the right indicates fluorescence intensity, which has been
normalized to DOC concentration. (Reprinted from Wickland et al., 2007, With kind permission from
Springer Science+Business Media.)