

Stedmon and Cory
284
despite growing on simple substrates (Ogawa et al., 2001). Bacteria can release between
14% and 31% of their carbon demand during growth (Kawasaki and Benner, 2006). In addition, grazing of bacteria by protozoans and cell lysis by viral infection also produce DOM
(Strom et al., 1997; Middelboe and Lyck, 2002). Similarly, phytoplankton also release
DOM during growth and as a result of grazing by zooplankton (Nagata, 2000). However,
it is currently unclear to what extent FDOM is directly produced at each level in the food
web. To date, studies have focused primarily on bacteria, phytoplankton, and zooplankton
and some examples are given here. Although there are a range of organisms that possess
fluorescent proteins and pigments, the discussion is focused on those fluorescent signals
that are present in high enough concentrations and persist for long enough to be detected
in natural DOM samples.
Determann et al. (1998) examined the fluorescence properties of several marine bacteria and phytoplankton species. The fluorescence signal from living bacteria was found
to be remarkably constant and dominated by a blue-shifted tryptophan fluorescence. The
fluorescence characteristics of the phytoplankton species investigated were slightly more
250
EX.
Em.
EX.
Em.
EX.
Em.
Ferulic acid
Tryptophan
C7 Stedmon &
Markager
(2005a)
C2 Murphy
et al (2006)
O
OH
OCH 3
OH
HO
OH
N
H
OH
O
H
H 2 N
NH 2
O
EX. Em.
p-Coumaric
Tyrosine
C8 Stedmon &
Markager (2005a)
C1 Murphy et al
(2006)
C3 Stedmon
& Markager
(2005b)
Normalsed fluorescence
Normalsed fluorescence
300 350 400
Wavelength (nm)
450 500
HO
HO
O
550 600 250 300 350 400
Wavelength (nm)
450 500 550 600
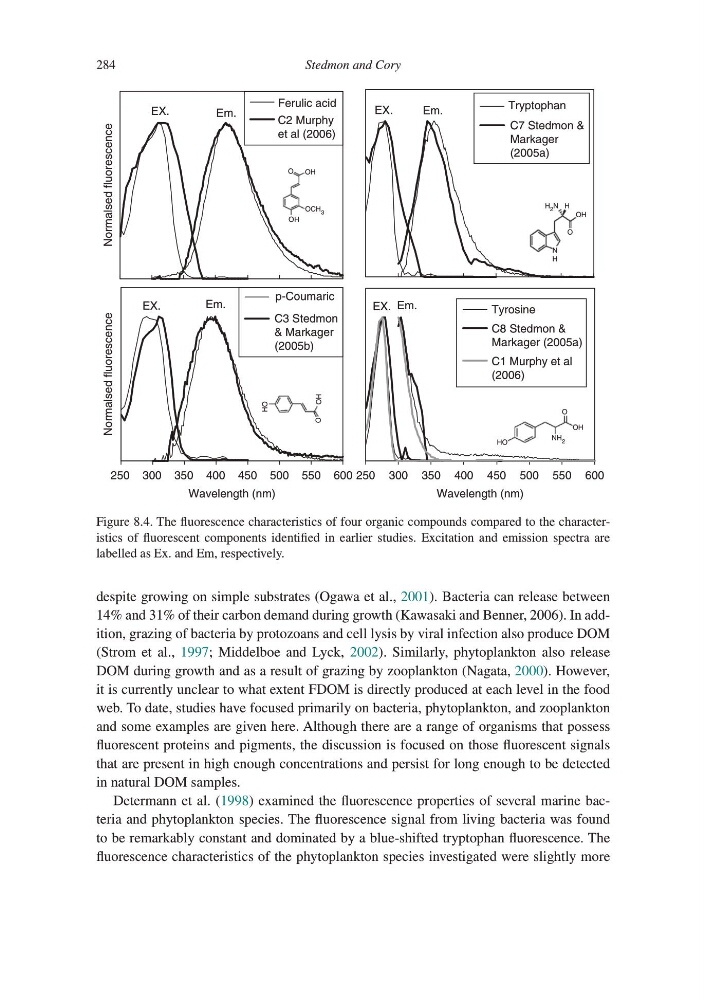
Figure 8.4. The fluorescence characteristics of four organic compounds compared to the characteristics of fluorescent components identified in earlier studies. Excitation and emission spectra are
labelled as Ex. and Em, respectively.
284
despite growing on simple substrates (Ogawa et al., 2001). Bacteria can release between
14% and 31% of their carbon demand during growth (Kawasaki and Benner, 2006). In addition, grazing of bacteria by protozoans and cell lysis by viral infection also produce DOM
(Strom et al., 1997; Middelboe and Lyck, 2002). Similarly, phytoplankton also release
DOM during growth and as a result of grazing by zooplankton (Nagata, 2000). However,
it is currently unclear to what extent FDOM is directly produced at each level in the food
web. To date, studies have focused primarily on bacteria, phytoplankton, and zooplankton
and some examples are given here. Although there are a range of organisms that possess
fluorescent proteins and pigments, the discussion is focused on those fluorescent signals
that are present in high enough concentrations and persist for long enough to be detected
in natural DOM samples.
Determann et al. (1998) examined the fluorescence properties of several marine bacteria and phytoplankton species. The fluorescence signal from living bacteria was found
to be remarkably constant and dominated by a blue-shifted tryptophan fluorescence. The
fluorescence characteristics of the phytoplankton species investigated were slightly more
250
EX.
Em.
EX.
Em.
EX.
Em.
Ferulic acid
Tryptophan
C7 Stedmon &
Markager
(2005a)
C2 Murphy
et al (2006)
O
OH
OCH 3
OH
HO
OH
N
H
OH
O
H
H 2 N
NH 2
O
EX. Em.
p-Coumaric
Tyrosine
C8 Stedmon &
Markager (2005a)
C1 Murphy et al
(2006)
C3 Stedmon
& Markager
(2005b)
Normalsed fluorescence
Normalsed fluorescence
300 350 400
Wavelength (nm)
450 500
HO
HO
O
550 600 250 300 350 400
Wavelength (nm)
450 500 550 600
Figure 8.4. The fluorescence characteristics of four organic compounds compared to the characteristics of fluorescent components identified in earlier studies. Excitation and emission spectra are
labelled as Ex. and Em, respectively.