

Conmy, Del Castillo, Downing, and Chen
210
decrease in fluorescence intensity resulting from the reabsorption of emitted light within a
solution. Previous studies have shown a 20% reduction in fluorescence response above 100
QSE (Gardner et al., 2005). To correct for this effect, the fluorescence of sample water and
a series of diluted samples mixed with purified water were measured. A quadratic response
curve (fluorescence vs. % whole water) was then calculated, where the linear portion of the
fitted equation represented instrument response in the absence of the IFE. The correction
factor was determined by dividing the linear portion of the fitted equation by the full equation, then applying it to the voltage output of the fluorometer. This estimated the response
of the instrument in the absence of inner filtering.
6.4.5 Dynamic Range
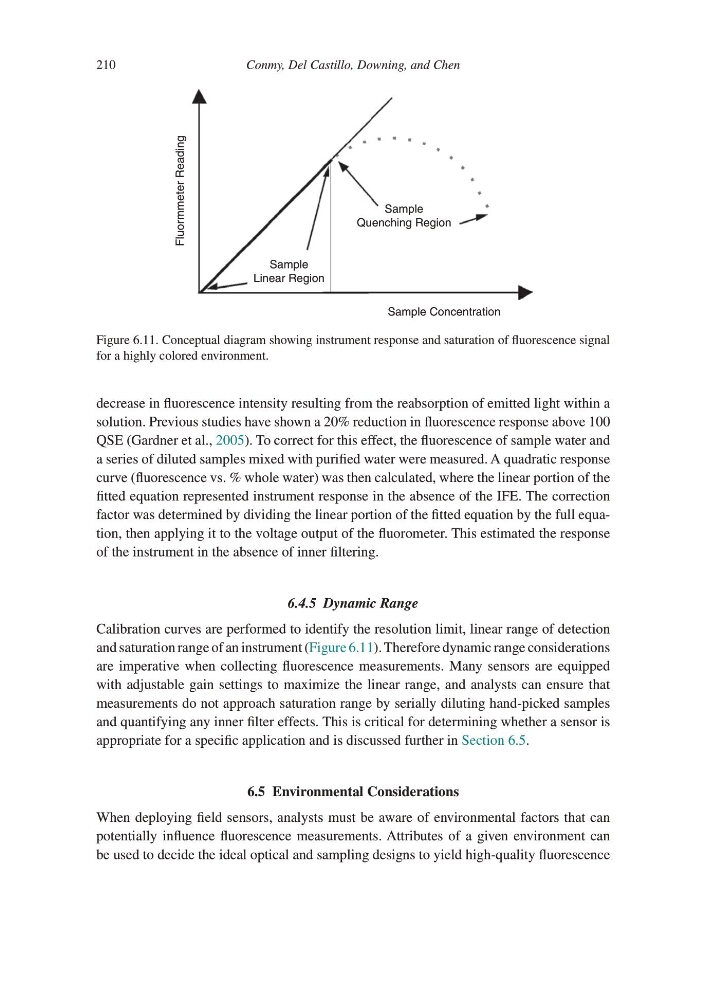
Calibration curves are performed to identify the resolution limit, linear range of detection
and saturation range of an instrument (Figure 6.11). Therefore dynamic range considerations
are imperative when collecting fluorescence measurements. Many sensors are equipped
with adjustable gain settings to maximize the linear range, and analysts can ensure that
measurements do not approach saturation range by serially diluting hand-picked samples
and quantifying any inner filter effects. This is critical for determining whether a sensor is
appropriate for a specific application and is discussed further in Section 6.5.
6.5 Environmental Considerations
When deploying field sensors, analysts must be aware of environmental factors that can
potentially influence fluorescence measurements. Attributes of a given environment can
be used to decide the ideal optical and sampling designs to yield high-quality fluorescence
Sample Concentration
Sample
Quenching Region
Sample
Linear Region
Fluormmeter Reading
Figure 6.11. Conceptual diagram showing instrument response and saturation of fluorescence signal
for a highly colored environment.
210
decrease in fluorescence intensity resulting from the reabsorption of emitted light within a
solution. Previous studies have shown a 20% reduction in fluorescence response above 100
QSE (Gardner et al., 2005). To correct for this effect, the fluorescence of sample water and
a series of diluted samples mixed with purified water were measured. A quadratic response
curve (fluorescence vs. % whole water) was then calculated, where the linear portion of the
fitted equation represented instrument response in the absence of the IFE. The correction
factor was determined by dividing the linear portion of the fitted equation by the full equation, then applying it to the voltage output of the fluorometer. This estimated the response
of the instrument in the absence of inner filtering.
6.4.5 Dynamic Range
Calibration curves are performed to identify the resolution limit, linear range of detection
and saturation range of an instrument (Figure 6.11). Therefore dynamic range considerations
are imperative when collecting fluorescence measurements. Many sensors are equipped
with adjustable gain settings to maximize the linear range, and analysts can ensure that
measurements do not approach saturation range by serially diluting hand-picked samples
and quantifying any inner filter effects. This is critical for determining whether a sensor is
appropriate for a specific application and is discussed further in Section 6.5.
6.5 Environmental Considerations
When deploying field sensors, analysts must be aware of environmental factors that can
potentially influence fluorescence measurements. Attributes of a given environment can
be used to decide the ideal optical and sampling designs to yield high-quality fluorescence
Sample Concentration
Sample
Quenching Region
Sample
Linear Region
Fluormmeter Reading
Figure 6.11. Conceptual diagram showing instrument response and saturation of fluorescence signal
for a highly colored environment.