

Experimental Design and Quality Assurance
209
is then similar to the QSE approach. Most commonly, the NOM method utilizes discrete
filtered samples that are collected coincident with fluorescence measurements from a field
sensor (Del Castillo et al., 2001; Conmy et al., 2004). Samples are analyzed with a benchtop fluorometer, where data are fully corrected and calibrated to QSE. A scaling factor is
applied to the in situ data through the equation,
scaling factor =
FL
FL
lab
in situ
(6.2)
where FL lab and FL in situ are fluorescence intensities for discrete samples and in situ data,
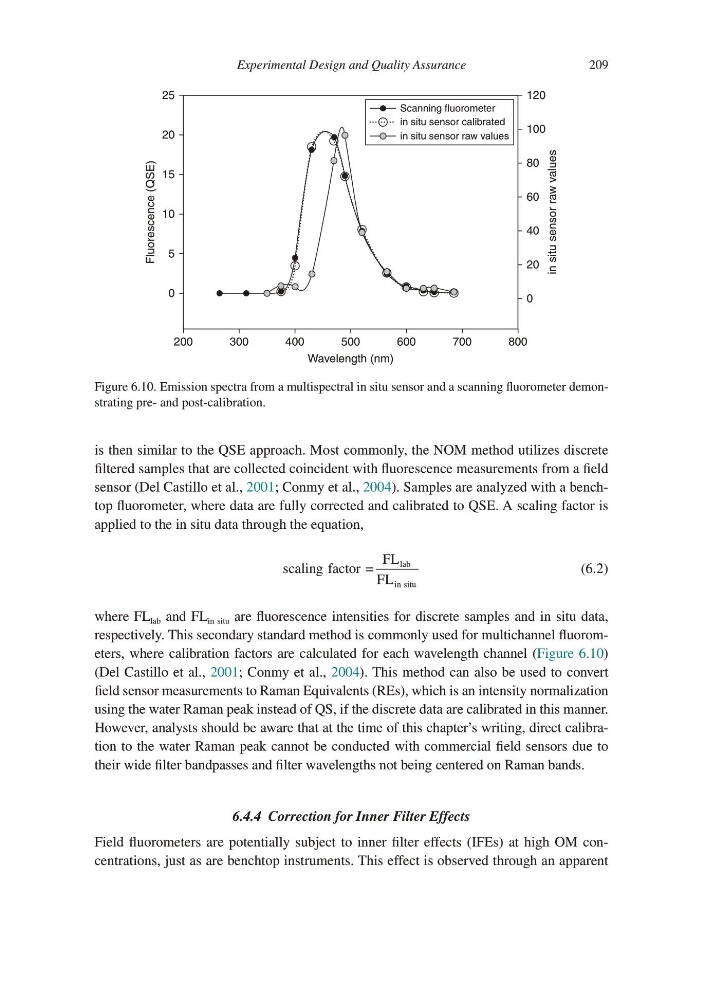
respectively. This secondary standard method is commonly used for multichannel fluorometers, where calibration factors are calculated for each wavelength channel (Figure 6.10)
(Del Castillo et al., 2001; Conmy et al., 2004). This method can also be used to convert
field sensor measurements to Raman Equivalents (REs), which is an intensity normalization
using the water Raman peak instead of QS, if the discrete data are calibrated in this manner.
However, analysts should be aware that at the time of this chapter’s writing, direct calibration to the water Raman peak cannot be conducted with commercial field sensors due to
their wide filter bandpasses and filter wavelengths not being centered on Raman bands.
6.4.4 Correction for Inner Filter Effects
Field fluorometers are potentially subject to inner filter effects (IFEs) at high OM concentrations, just as are benchtop instruments. This effect is observed through an apparent
200
0
0
20
40
in situ sensor raw values
60
80
100
120
5
10
Fluorescence (QSE)
15
20
25
300
400
500
Wavelength (nm)
600
700
800
Scanning fluorometer
in situ sensor calibrated
in situ sensor raw values
Figure 6.10. Emission spectra from a multispectral in situ sensor and a scanning fluorometer demonstrating pre- and post-calibration.
209
is then similar to the QSE approach. Most commonly, the NOM method utilizes discrete
filtered samples that are collected coincident with fluorescence measurements from a field
sensor (Del Castillo et al., 2001; Conmy et al., 2004). Samples are analyzed with a benchtop fluorometer, where data are fully corrected and calibrated to QSE. A scaling factor is
applied to the in situ data through the equation,
scaling factor =
FL
FL
lab
in situ
(6.2)
where FL lab and FL in situ are fluorescence intensities for discrete samples and in situ data,
respectively. This secondary standard method is commonly used for multichannel fluorometers, where calibration factors are calculated for each wavelength channel (Figure 6.10)
(Del Castillo et al., 2001; Conmy et al., 2004). This method can also be used to convert
field sensor measurements to Raman Equivalents (REs), which is an intensity normalization
using the water Raman peak instead of QS, if the discrete data are calibrated in this manner.
However, analysts should be aware that at the time of this chapter’s writing, direct calibration to the water Raman peak cannot be conducted with commercial field sensors due to
their wide filter bandpasses and filter wavelengths not being centered on Raman bands.
6.4.4 Correction for Inner Filter Effects
Field fluorometers are potentially subject to inner filter effects (IFEs) at high OM concentrations, just as are benchtop instruments. This effect is observed through an apparent
200
0
0
20
40
in situ sensor raw values
60
80
100
120
5
10
Fluorescence (QSE)
15
20
25
300
400
500
Wavelength (nm)
600
700
800
Scanning fluorometer
in situ sensor calibrated
in situ sensor raw values
Figure 6.10. Emission spectra from a multispectral in situ sensor and a scanning fluorometer demonstrating pre- and post-calibration.