

Gilchrist and Reynolds
182
changes in the light source or the sample. Therefore, it is necessary to characterize the
excitation channel in terms of how much light, in relative terms, is incident upon the
sample. For this, the excitation channel of a fluorimeter is calibrated to ensure that the
excitation spectrum exhibits the correct spectra in terms of intensity and wavelength
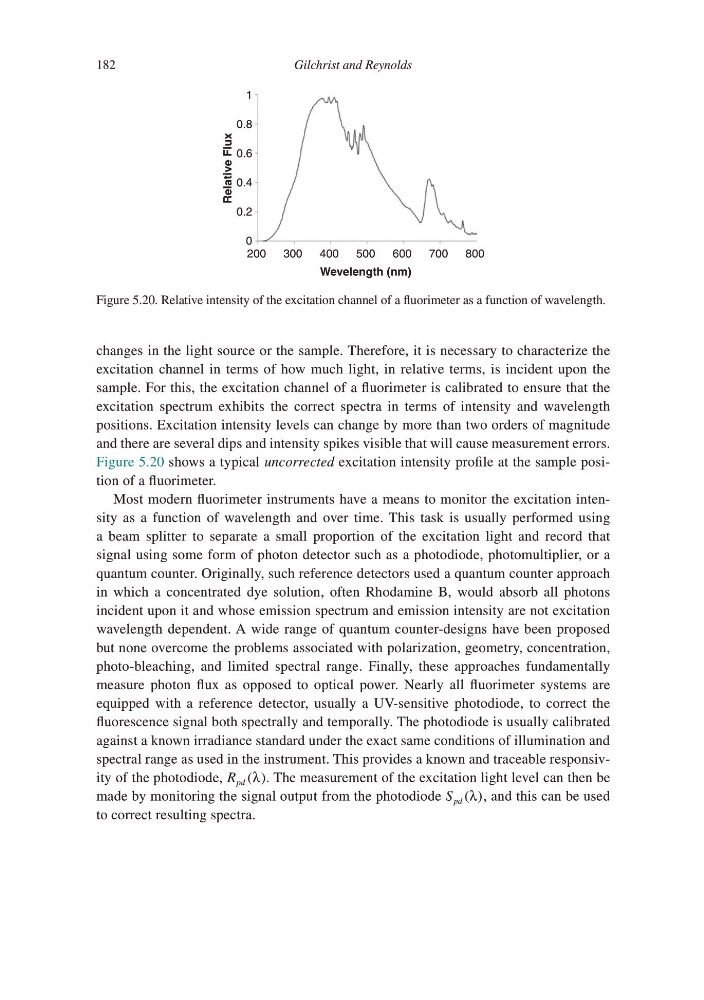
positions. Excitation intensity levels can change by more than two orders of magnitude
and there are several dips and intensity spikes visible that will cause measurement errors.
Figure 5.20 shows a typical uncorrected excitation intensity profile at the sample position of a fluorimeter.
Most modern fluorimeter instruments have a means to monitor the excitation intensity as a function of wavelength and over time. This task is usually performed using
a beam splitter to separate a small proportion of the excitation light and record that
signal using some form of photon detector such as a photodiode, photomultiplier, or a
quantum counter. Originally, such reference detectors used a quantum counter approach
in which a concentrated dye solution, often Rhodamine B, would absorb all photons
incident upon it and whose emission spectrum and emission intensity are not excitation
wavelength dependent. A wide range of quantum counter-designs have been proposed
but none overcome the problems associated with polarization, geometry, concentration,
photo-bleaching, and limited spectral range. Finally, these approaches fundamentally
measure photon flux as opposed to optical power. Nearly all fluorimeter systems are
equipped with a reference detector, usually a UV-sensitive photodiode, to correct the
fluorescence signal both spectrally and temporally. The photodiode is usually calibrated
against a known irradiance standard under the exact same conditions of illumination and
spectral range as used in the instrument. This provides a known and traceable responsivity of the photodiode, R pd ( )
λ . The measurement of the excitation light level can then be
made by monitoring the signal output from the photodiode S pd ( )
λ , and this can be used
to correct resulting spectra.
200
1
0.8
0.6
0.4
0.2
Relative Flux
0
700
600
500
Wevelength (nm)
400
800
300
Figure 5.20. Relative intensity of the excitation channel of a fluorimeter as a function of wavelength.
182
changes in the light source or the sample. Therefore, it is necessary to characterize the
excitation channel in terms of how much light, in relative terms, is incident upon the
sample. For this, the excitation channel of a fluorimeter is calibrated to ensure that the
excitation spectrum exhibits the correct spectra in terms of intensity and wavelength
positions. Excitation intensity levels can change by more than two orders of magnitude
and there are several dips and intensity spikes visible that will cause measurement errors.
Figure 5.20 shows a typical uncorrected excitation intensity profile at the sample position of a fluorimeter.
Most modern fluorimeter instruments have a means to monitor the excitation intensity as a function of wavelength and over time. This task is usually performed using
a beam splitter to separate a small proportion of the excitation light and record that
signal using some form of photon detector such as a photodiode, photomultiplier, or a
quantum counter. Originally, such reference detectors used a quantum counter approach
in which a concentrated dye solution, often Rhodamine B, would absorb all photons
incident upon it and whose emission spectrum and emission intensity are not excitation
wavelength dependent. A wide range of quantum counter-designs have been proposed
but none overcome the problems associated with polarization, geometry, concentration,
photo-bleaching, and limited spectral range. Finally, these approaches fundamentally
measure photon flux as opposed to optical power. Nearly all fluorimeter systems are
equipped with a reference detector, usually a UV-sensitive photodiode, to correct the
fluorescence signal both spectrally and temporally. The photodiode is usually calibrated
against a known irradiance standard under the exact same conditions of illumination and
spectral range as used in the instrument. This provides a known and traceable responsivity of the photodiode, R pd ( )
λ . The measurement of the excitation light level can then be
made by monitoring the signal output from the photodiode S pd ( )
λ , and this can be used
to correct resulting spectra.
200
1
0.8
0.6
0.4
0.2
Relative Flux
0
700
600
500
Wevelength (nm)
400
800
300
Figure 5.20. Relative intensity of the excitation channel of a fluorimeter as a function of wavelength.