

Gilchrist and Reynolds
176
is to undertake measurements using a suitable line source lamp such as a low-pressure
mercury lamp. This lamp provides a range of discrete lines that can be used to demonstrate
the wavelength calibration of the system as well as wavelength linearity. At the same time
it can be used to demonstrate the correct and repeatable operation of the grating turret.
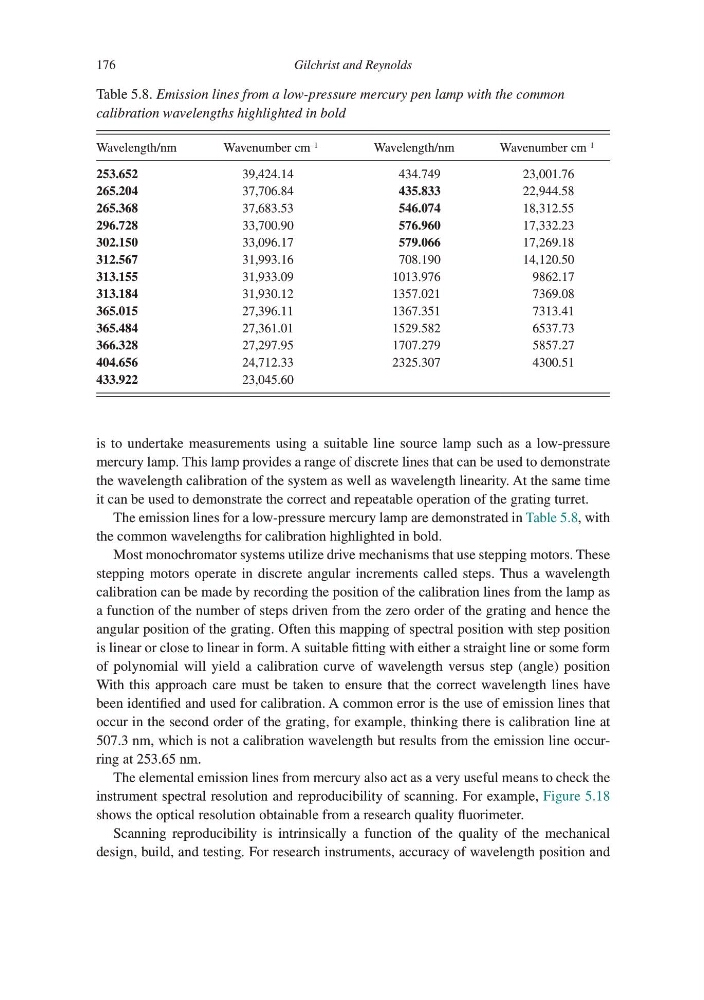
The emission lines for a low-pressure mercury lamp are demonstrated in Table 5.8, with
the common wavelengths for calibration highlighted in bold.
Most monochromator systems utilize drive mechanisms that use stepping motors. These
stepping motors operate in discrete angular increments called steps. Thus a wavelength
calibration can be made by recording the position of the calibration lines from the lamp as
a function of the number of steps driven from the zero order of the grating and hence the
angular position of the grating. Often this mapping of spectral position with step position
is linear or close to linear in form. A suitable fitting with either a straight line or some form
of polynomial will yield a calibration curve of wavelength versus step (angle) position
With this approach care must be taken to ensure that the correct wavelength lines have
been identified and used for calibration. A common error is the use of emission lines that
occur in the second order of the grating, for example, thinking there is calibration line at
507.3 nm, which is not a calibration wavelength but results from the emission line occurring at 253.65 nm.
The elemental emission lines from mercury also act as a very useful means to check the
instrument spectral resolution and reproducibility of scanning. For example, Figure 5.18
shows the optical resolution obtainable from a research quality fluorimeter.
Scanning reproducibility is intrinsically a function of the quality of the mechanical
design, build, and testing. For research instruments, accuracy of wavelength position and
Table 5.8. Emission lines from a low-pressure mercury pen lamp with the common
calibration wavelengths highlighted in bold
Wavelength/nm
Wavenumber cm
–1
Wavelength/nm
Wavenumber cm
–1
253.652
39,424.14
434.749
23,001.76
265.204
37,706.84
435.833
22,944.58
265.368
37,683.53
546.074
18,312.55
296.728
33,700.90
576.960
17,332.23
302.150
33,096.17
579.066
17,269.18
312.567
31,993.16
708.190
14,120.50
313.155
31,933.09
1013.976
9862.17
313.184
31,930.12
1357.021
7369.08
365.015
27,396.11
1367.351
7313.41
365.484
27,361.01
1529.582
6537.73
366.328
27,297.95
1707.279
5857.27
404.656
24,712.33
2325.307
4300.51
433.922
23,045.60
176
is to undertake measurements using a suitable line source lamp such as a low-pressure
mercury lamp. This lamp provides a range of discrete lines that can be used to demonstrate
the wavelength calibration of the system as well as wavelength linearity. At the same time
it can be used to demonstrate the correct and repeatable operation of the grating turret.
The emission lines for a low-pressure mercury lamp are demonstrated in Table 5.8, with
the common wavelengths for calibration highlighted in bold.
Most monochromator systems utilize drive mechanisms that use stepping motors. These
stepping motors operate in discrete angular increments called steps. Thus a wavelength
calibration can be made by recording the position of the calibration lines from the lamp as
a function of the number of steps driven from the zero order of the grating and hence the
angular position of the grating. Often this mapping of spectral position with step position
is linear or close to linear in form. A suitable fitting with either a straight line or some form
of polynomial will yield a calibration curve of wavelength versus step (angle) position
With this approach care must be taken to ensure that the correct wavelength lines have
been identified and used for calibration. A common error is the use of emission lines that
occur in the second order of the grating, for example, thinking there is calibration line at
507.3 nm, which is not a calibration wavelength but results from the emission line occurring at 253.65 nm.
The elemental emission lines from mercury also act as a very useful means to check the
instrument spectral resolution and reproducibility of scanning. For example, Figure 5.18
shows the optical resolution obtainable from a research quality fluorimeter.
Scanning reproducibility is intrinsically a function of the quality of the mechanical
design, build, and testing. For research instruments, accuracy of wavelength position and
Table 5.8. Emission lines from a low-pressure mercury pen lamp with the common
calibration wavelengths highlighted in bold
Wavelength/nm
Wavenumber cm
–1
Wavelength/nm
Wavenumber cm
–1
253.652
39,424.14
434.749
23,001.76
265.204
37,706.84
435.833
22,944.58
265.368
37,683.53
546.074
18,312.55
296.728
33,700.90
576.960
17,332.23
302.150
33,096.17
579.066
17,269.18
312.567
31,993.16
708.190
14,120.50
313.155
31,933.09
1013.976
9862.17
313.184
31,930.12
1357.021
7369.08
365.015
27,396.11
1367.351
7313.41
365.484
27,361.01
1529.582
6537.73
366.328
27,297.95
1707.279
5857.27
404.656
24,712.33
2325.307
4300.51
433.922
23,045.60