

Spencer and Coble
140
1995; Patel-Sorrentino et al., 2002; Spencer et al., 2007c). At the typical pH levels found in
most aquatic systems (4.5–8.5) little change in DOM spectrophotometric parameters have
been reported indicating that changes in spectrophotometric parameters in aquatic systems are typically due to other processes and are not merely due to pH change (Reynolds
and Ahmad, 1995; Spencer et al., 2007b,c; Hudson et al., 2009; Peiris et al., 2010). It is
therefore recommended that for studies aiming to examine the role of DOM in ecosystem
biogeochemistry that spectrophotometric analyses be undertaken at natural sample pH. It
is further recommended that if possible the range of pH values of the samples should be
reported to show they are not at an extreme of pH where significant variations in DOM
optical properties may be observed.
4.5 Summary and Future Needs
The application of standard organic geochemical protocols utilizing rigorous cleaning,
blanks and replicates are fundamental to ensuring high-quality CDOM absorbance and fluorescence data. Filtration of samples immediately after collection is recommended to stop
biological processes and to remove particles that can interfere with CDOM absorbance and
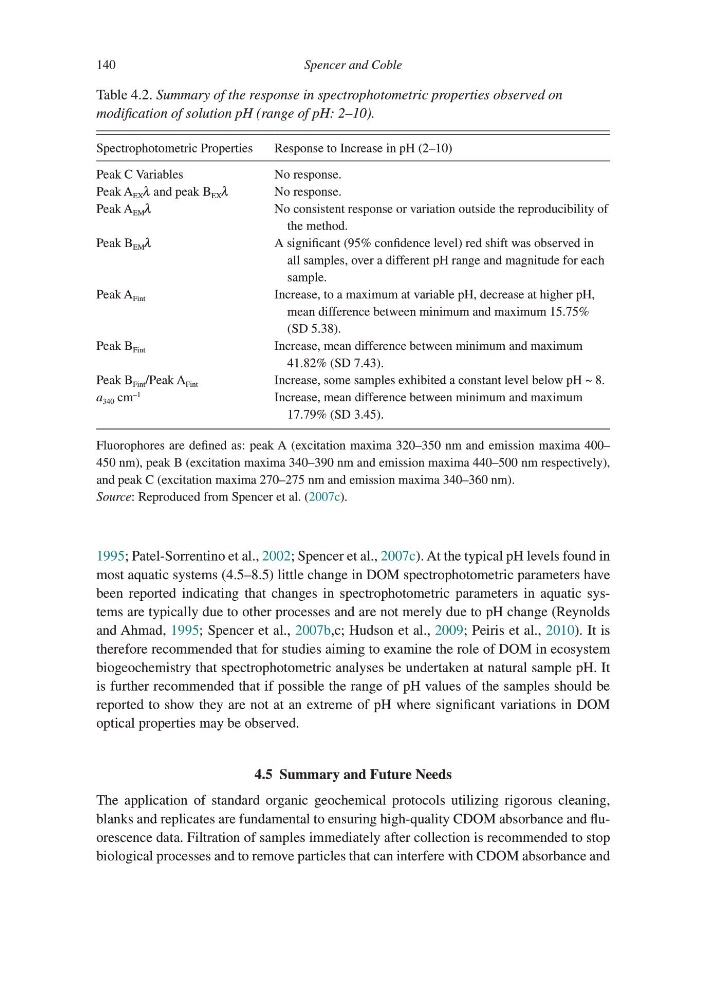
Table 4.2. Summary of the response in spectrophotometric properties observed on
modification of solution pH (range of pH: 2–10).
Spectrophotometric Properties
Response to Increase in pH (2–10)
Peak C Variables
No response.
Peak A EX λ and peak B EX λ
No response.
Peak A EM λ
No consistent response or variation outside the reproducibility of
the method.
Peak B EM λ
A significant (95% confidence level) red shift was observed in
all samples, over a different pH range and magnitude for each
sample.
Peak A Fint
Increase, to a maximum at variable pH, decrease at higher pH,
mean difference between minimum and maximum 15.75%
(SD 5.38).
Peak B Fint
Increase, mean difference between minimum and maximum
41.82% (SD 7.43).
Peak B Fint /Peak A Fint
Increase, some samples exhibited a constant level below pH ~ 8.
a 340 cm
–1
Increase, mean difference between minimum and maximum
17.79% (SD 3.45).
Fluorophores are defined as: peak A (excitation maxima 320–350 nm and emission maxima 400–
450 nm), peak B (excitation maxima 340–390 nm and emission maxima 440–500 nm respectively),
and peak C (excitation maxima 270–275 nm and emission maxima 340–360 nm).
Source: Reproduced from Spencer et al. (2007c).
140
1995; Patel-Sorrentino et al., 2002; Spencer et al., 2007c). At the typical pH levels found in
most aquatic systems (4.5–8.5) little change in DOM spectrophotometric parameters have
been reported indicating that changes in spectrophotometric parameters in aquatic systems are typically due to other processes and are not merely due to pH change (Reynolds
and Ahmad, 1995; Spencer et al., 2007b,c; Hudson et al., 2009; Peiris et al., 2010). It is
therefore recommended that for studies aiming to examine the role of DOM in ecosystem
biogeochemistry that spectrophotometric analyses be undertaken at natural sample pH. It
is further recommended that if possible the range of pH values of the samples should be
reported to show they are not at an extreme of pH where significant variations in DOM
optical properties may be observed.
4.5 Summary and Future Needs
The application of standard organic geochemical protocols utilizing rigorous cleaning,
blanks and replicates are fundamental to ensuring high-quality CDOM absorbance and fluorescence data. Filtration of samples immediately after collection is recommended to stop
biological processes and to remove particles that can interfere with CDOM absorbance and
Table 4.2. Summary of the response in spectrophotometric properties observed on
modification of solution pH (range of pH: 2–10).
Spectrophotometric Properties
Response to Increase in pH (2–10)
Peak C Variables
No response.
Peak A EX λ and peak B EX λ
No response.
Peak A EM λ
No consistent response or variation outside the reproducibility of
the method.
Peak B EM λ
A significant (95% confidence level) red shift was observed in
all samples, over a different pH range and magnitude for each
sample.
Peak A Fint
Increase, to a maximum at variable pH, decrease at higher pH,
mean difference between minimum and maximum 15.75%
(SD 5.38).
Peak B Fint
Increase, mean difference between minimum and maximum
41.82% (SD 7.43).
Peak B Fint /Peak A Fint
Increase, some samples exhibited a constant level below pH ~ 8.
a 340 cm
–1
Increase, mean difference between minimum and maximum
17.79% (SD 3.45).
Fluorophores are defined as: peak A (excitation maxima 320–350 nm and emission maxima 400–
450 nm), peak B (excitation maxima 340–390 nm and emission maxima 440–500 nm respectively),
and peak C (excitation maxima 270–275 nm and emission maxima 340–360 nm).
Source: Reproduced from Spencer et al. (2007c).