

Sampling Design for Organic Matter Fluorescence Analysis
139
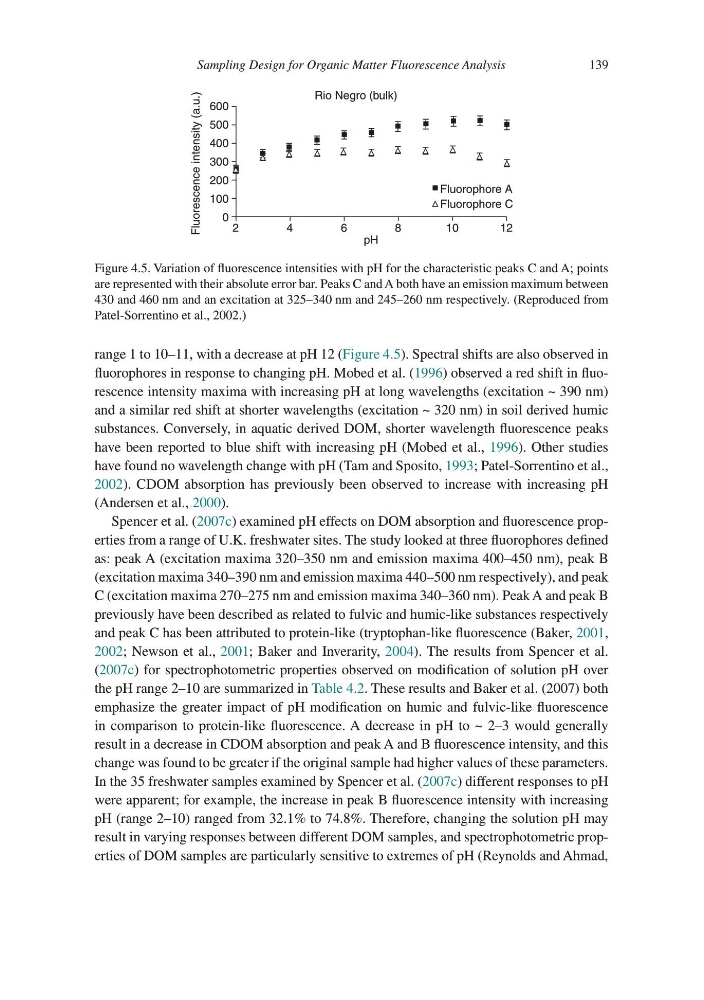
range 1 to 10–11, with a decrease at pH 12 (Figure 4.5). Spectral shifts are also observed in
fluorophores in response to changing pH. Mobed et al. (1996) observed a red shift in fluorescence intensity maxima with increasing pH at long wavelengths (excitation ~ 390 nm)
and a similar red shift at shorter wavelengths (excitation ~ 320 nm) in soil derived humic
substances. Conversely, in aquatic derived DOM, shorter wavelength fluorescence peaks
have been reported to blue shift with increasing pH (Mobed et al., 1996). Other studies
have found no wavelength change with pH (Tam and Sposito, 1993; Patel-Sorrentino et al.,
2002). CDOM absorption has previously been observed to increase with increasing pH
(Andersen et al., 2000).
Spencer et al. (2007c) examined pH effects on DOM absorption and fluorescence properties from a range of U.K. freshwater sites. The study looked at three fluorophores defined
as: peak A (excitation maxima 320–350 nm and emission maxima 400–450 nm), peak B
(excitation maxima 340–390 nm and emission maxima 440–500 nm respectively), and peak
C (excitation maxima 270–275 nm and emission maxima 340–360 nm). Peak A and peak B
previously have been described as related to fulvic and humic-like substances respectively
and peak C has been attributed to protein-like (tryptophan-like fluorescence (Baker, 2001,
2002; Newson et al., 2001; Baker and Inverarity, 2004). The results from Spencer et al.
(2007c) for spectrophotometric properties observed on modification of solution pH over
the pH range 2–10 are summarized in Table 4.2. These results and Baker et al. (2007) both
emphasize the greater impact of pH modification on humic and fulvic-like fluorescence
in comparison to protein-like fluorescence. A decrease in pH to ~ 2–3 would generally
result in a decrease in CDOM absorption and peak A and B fluorescence intensity, and this
change was found to be greater if the original sample had higher values of these parameters.
In the 35 freshwater samples examined by Spencer et al. (2007c) different responses to pH
were apparent; for example, the increase in peak B fluorescence intensity with increasing
pH (range 2–10) ranged from 32.1% to 74.8%. Therefore, changing the solution pH may
result in varying responses between different DOM samples, and spectrophotometric properties of DOM samples are particularly sensitive to extremes of pH (Reynolds and Ahmad,
600
Fluorescence intensity (a.u.)
500
400
300
200
100
0
Fluorophore A
Rio Negro (bulk)
Fluorophore C
2
4
6
pH
8
1 0
1 2
Figure 4.5. Variation of fluorescence intensities with pH for the characteristic peaks C and A; points
are represented with their absolute error bar. Peaks C and A both have an emission maximum between
430 and 460 nm and an excitation at 325–340 nm and 245–260 nm respectively. (Reproduced from
Patel-Sorrentino et al., 2002.)
139
range 1 to 10–11, with a decrease at pH 12 (Figure 4.5). Spectral shifts are also observed in
fluorophores in response to changing pH. Mobed et al. (1996) observed a red shift in fluorescence intensity maxima with increasing pH at long wavelengths (excitation ~ 390 nm)
and a similar red shift at shorter wavelengths (excitation ~ 320 nm) in soil derived humic
substances. Conversely, in aquatic derived DOM, shorter wavelength fluorescence peaks
have been reported to blue shift with increasing pH (Mobed et al., 1996). Other studies
have found no wavelength change with pH (Tam and Sposito, 1993; Patel-Sorrentino et al.,
2002). CDOM absorption has previously been observed to increase with increasing pH
(Andersen et al., 2000).
Spencer et al. (2007c) examined pH effects on DOM absorption and fluorescence properties from a range of U.K. freshwater sites. The study looked at three fluorophores defined
as: peak A (excitation maxima 320–350 nm and emission maxima 400–450 nm), peak B
(excitation maxima 340–390 nm and emission maxima 440–500 nm respectively), and peak
C (excitation maxima 270–275 nm and emission maxima 340–360 nm). Peak A and peak B
previously have been described as related to fulvic and humic-like substances respectively
and peak C has been attributed to protein-like (tryptophan-like fluorescence (Baker, 2001,
2002; Newson et al., 2001; Baker and Inverarity, 2004). The results from Spencer et al.
(2007c) for spectrophotometric properties observed on modification of solution pH over
the pH range 2–10 are summarized in Table 4.2. These results and Baker et al. (2007) both
emphasize the greater impact of pH modification on humic and fulvic-like fluorescence
in comparison to protein-like fluorescence. A decrease in pH to ~ 2–3 would generally
result in a decrease in CDOM absorption and peak A and B fluorescence intensity, and this
change was found to be greater if the original sample had higher values of these parameters.
In the 35 freshwater samples examined by Spencer et al. (2007c) different responses to pH
were apparent; for example, the increase in peak B fluorescence intensity with increasing
pH (range 2–10) ranged from 32.1% to 74.8%. Therefore, changing the solution pH may
result in varying responses between different DOM samples, and spectrophotometric properties of DOM samples are particularly sensitive to extremes of pH (Reynolds and Ahmad,
600
Fluorescence intensity (a.u.)
500
400
300
200
100
0
Fluorophore A
Rio Negro (bulk)
Fluorophore C
2
4
6
pH
8
1 0
1 2
Figure 4.5. Variation of fluorescence intensities with pH for the characteristic peaks C and A; points
are represented with their absolute error bar. Peaks C and A both have an emission maximum between
430 and 460 nm and an excitation at 325–340 nm and 245–260 nm respectively. (Reproduced from
Patel-Sorrentino et al., 2002.)