

Aquatic Organic Matter Fluorescence
95
like fluorescence was removed at a faster rate than bulk concentrations of DOC and DON,
highlighting that certain DOM moieties were preferentially removed, which is consistent with the idea that different DOM pools turn over at different rates (Brookshire et al.,
2005; Fellman et al., 2009c). Therefore, future studies seeking to examine DOM uptake in
freshwater ecosystems could gain insight into the role of DOM pools with different reactivities by combining instream tracer releases with fluorescence characterization of DOM
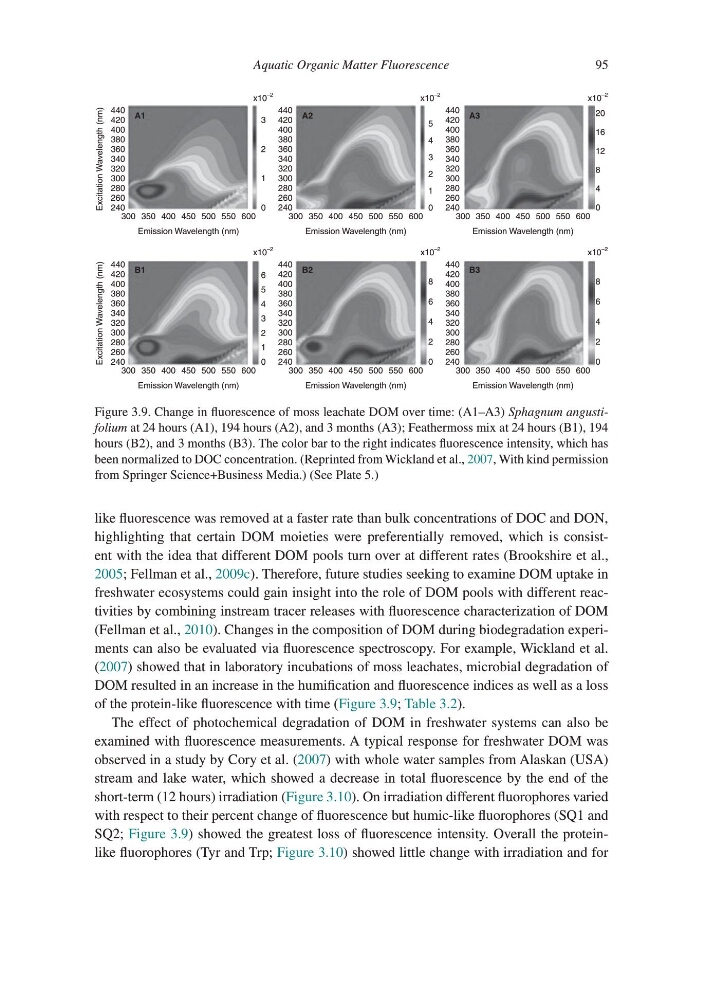
(Fellman et al., 2010). Changes in the composition of DOM during biodegradation experiments can also be evaluated via fluorescence spectroscopy. For example, Wickland et al.
(2007) showed that in laboratory incubations of moss leachates, microbial degradation of
DOM resulted in an increase in the humification and fluorescence indices as well as a loss
of the protein-like fluorescence with time (Figure 3.9; Table 3.2).
The effect of photochemical degradation of DOM in freshwater systems can also be
examined with fluorescence measurements. A typical response for freshwater DOM was
observed in a study by Cory et al. (2007) with whole water samples from Alaskan (USA)
stream and lake water, which showed a decrease in total fluorescence by the end of the
short-term (12 hours) irradiation (Figure 3.10). On irradiation different fluorophores varied
with respect to their percent change of fluorescence but humic-like fluorophores (SQ1 and
SQ2; Figure 3.9) showed the greatest loss of fluorescence intensity. Overall the proteinlike fluorophores (Tyr and Trp; Figure 3.10) showed little change with irradiation and for
0
1
2
3
x10
–2
300 350 400 450 500 550 600
A1
Excitation Wavelength (nm)
Emission Wavelength (nm)
240
260
280
300
320
340
360
380
400
420
440
0
2
1
4
5
3
6
x10
–2
300 350 400 450 500 550 600
B1
Excitation Wavelength (nm)
Emission Wavelength (nm)
240
260
280
300
320
340
360
380
400
420
440
0
1
4
3
2
5
x10
–2
300 350 400 450 500 550 600
A2
Emission Wavelength (nm)
240
260
280
300
320
340
360
380
400
420
440
0
4
2
6
8
0
4
2
6
8
x10
–2
300 350 400 450 500 550 600
B2
Emission Wavelength (nm)
240
260
280
300
320
340
360
380
400
420
440
0
4
8
12
16
20
x10
–2
300 350 400 450 500 550 600
A3
Emission Wavelength (nm)
240
260
280
300
320
340
360
380
400
420
440
x10
–2
300 350 400 450 500 550 600
B3
Emission Wavelength (nm)
240
260
280
300
320
340
360
380
400
420
440
Figure 3.9. Change in fluorescence of moss leachate DOM over time: (A1–A3) Sphagnum angustifolium at 24 hours (A1), 194 hours (A2), and 3 months (A3); Feathermoss mix at 24 hours (B1), 194
hours (B2), and 3 months (B3). The color bar to the right indicates fluorescence intensity, which has
been normalized to DOC concentration. (Reprinted from Wickland et al., 2007, With kind permission
from Springer Science+Business Media.) (See Plate 5.)
95
like fluorescence was removed at a faster rate than bulk concentrations of DOC and DON,
highlighting that certain DOM moieties were preferentially removed, which is consistent with the idea that different DOM pools turn over at different rates (Brookshire et al.,
2005; Fellman et al., 2009c). Therefore, future studies seeking to examine DOM uptake in
freshwater ecosystems could gain insight into the role of DOM pools with different reactivities by combining instream tracer releases with fluorescence characterization of DOM
(Fellman et al., 2010). Changes in the composition of DOM during biodegradation experiments can also be evaluated via fluorescence spectroscopy. For example, Wickland et al.
(2007) showed that in laboratory incubations of moss leachates, microbial degradation of
DOM resulted in an increase in the humification and fluorescence indices as well as a loss
of the protein-like fluorescence with time (Figure 3.9; Table 3.2).
The effect of photochemical degradation of DOM in freshwater systems can also be
examined with fluorescence measurements. A typical response for freshwater DOM was
observed in a study by Cory et al. (2007) with whole water samples from Alaskan (USA)
stream and lake water, which showed a decrease in total fluorescence by the end of the
short-term (12 hours) irradiation (Figure 3.10). On irradiation different fluorophores varied
with respect to their percent change of fluorescence but humic-like fluorophores (SQ1 and
SQ2; Figure 3.9) showed the greatest loss of fluorescence intensity. Overall the proteinlike fluorophores (Tyr and Trp; Figure 3.10) showed little change with irradiation and for
0
1
2
3
x10
–2
300 350 400 450 500 550 600
A1
Excitation Wavelength (nm)
Emission Wavelength (nm)
240
260
280
300
320
340
360
380
400
420
440
0
2
1
4
5
3
6
x10
–2
300 350 400 450 500 550 600
B1
Excitation Wavelength (nm)
Emission Wavelength (nm)
240
260
280
300
320
340
360
380
400
420
440
0
1
4
3
2
5
x10
–2
300 350 400 450 500 550 600
A2
Emission Wavelength (nm)
240
260
280
300
320
340
360
380
400
420
440
0
4
2
6
8
0
4
2
6
8
x10
–2
300 350 400 450 500 550 600
B2
Emission Wavelength (nm)
240
260
280
300
320
340
360
380
400
420
440
0
4
8
12
16
20
x10
–2
300 350 400 450 500 550 600
A3
Emission Wavelength (nm)
240
260
280
300
320
340
360
380
400
420
440
x10
–2
300 350 400 450 500 550 600
B3
Emission Wavelength (nm)
240
260
280
300
320
340
360
380
400
420
440
Figure 3.9. Change in fluorescence of moss leachate DOM over time: (A1–A3) Sphagnum angustifolium at 24 hours (A1), 194 hours (A2), and 3 months (A3); Feathermoss mix at 24 hours (B1), 194
hours (B2), and 3 months (B3). The color bar to the right indicates fluorescence intensity, which has
been normalized to DOC concentration. (Reprinted from Wickland et al., 2007, With kind permission
from Springer Science+Business Media.) (See Plate 5.)