

compared to the same group that does not have the hydrogen bond.
Because the secondary structure has well-defined hydrogen-bonding
patterns, this results in highly characteristic vibrational spectra. For
example, the amide I mode has typical frequencies at: 1650–1660 cm
−1
for an α helix, 1630–1640 cm
−1 for a β sheet, and 1680–1700 cm
−1 for
no hydrogen bond.
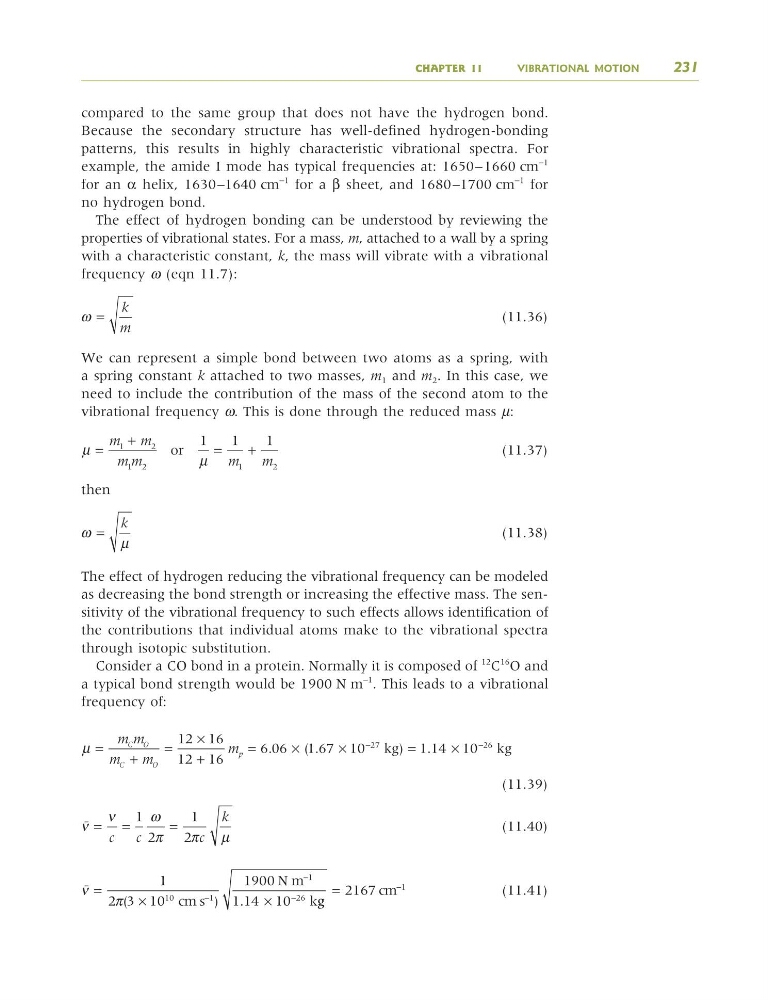
The effect of hydrogen bonding can be understood by reviewing the
properties of vibrational states. For a mass, m, attached to a wall by a spring
with a characteristic constant, k, the mass will vibrate with a vibrational
frequency ω (eqn 11.7):
(11.36)
We can represent a simple bond between two atoms as a spring, with
a spring constant k attached to two masses, m 1 and m 2 . In this case, we
need to include the contribution of the mass of the second atom to the
vibrational frequency ω. This is done through the reduced mass μ:
(11.37)
then
(11.38)
The effect of hydrogen reducing the vibrational frequency can be modeled
as decreasing the bond strength or increasing the effective mass. The sensitivity of the vibrational frequency to such effects allows identification of
the contributions that individual atoms make to the vibrational spectra
through isotopic substitution.
Consider a CO bond in a protein. Normally it is composed of
12
C
16
O and
a typical bond strength would be 1900 N m
−1
. This leads to a vibrational
frequency of:
(11.39)
(11.40)
(11.41)
A
(
) .
=
×
×
−
−
−
1
2 3 10
1900
1 14 10
10
1
1
26
π
cm s
N m
kg g
cm
=
−
2167
1
A = =
=
ν
ω
π
π
μ
c
c
c
k
1
2
1
2
μ
.
=
+
=
×
+
=
×
m m
m
m
m
C O
C
O
p
12 16
12 16
6 06 ( .
)
.
1 67 10
1 14 10
27
26
×
=
×
−
−
kg
kg
ω
μ
=
k
μ
μ
=
+
=
+
m m
m m
m
m
1
2
1 2
1
2
1
1
1
or
ω =
k
m
CHAPTER 11
VIBRATIONAL MOTION
231
9781405124362_4_011.qxd 4/29/08 9:11 Page 231
Because the secondary structure has well-defined hydrogen-bonding
patterns, this results in highly characteristic vibrational spectra. For
example, the amide I mode has typical frequencies at: 1650–1660 cm
−1
for an α helix, 1630–1640 cm
−1 for a β sheet, and 1680–1700 cm
−1 for
no hydrogen bond.
The effect of hydrogen bonding can be understood by reviewing the
properties of vibrational states. For a mass, m, attached to a wall by a spring
with a characteristic constant, k, the mass will vibrate with a vibrational
frequency ω (eqn 11.7):
(11.36)
We can represent a simple bond between two atoms as a spring, with
a spring constant k attached to two masses, m 1 and m 2 . In this case, we
need to include the contribution of the mass of the second atom to the
vibrational frequency ω. This is done through the reduced mass μ:
(11.37)
then
(11.38)
The effect of hydrogen reducing the vibrational frequency can be modeled
as decreasing the bond strength or increasing the effective mass. The sensitivity of the vibrational frequency to such effects allows identification of
the contributions that individual atoms make to the vibrational spectra
through isotopic substitution.
Consider a CO bond in a protein. Normally it is composed of
12
C
16
O and
a typical bond strength would be 1900 N m
−1
. This leads to a vibrational
frequency of:
(11.39)
(11.40)
(11.41)
A
(
) .
=
×
×
−
−
−
1
2 3 10
1900
1 14 10
10
1
1
26
π
cm s
N m
kg g
cm
=
−
2167
1
A = =
=
ν
ω
π
π
μ
c
c
c
k
1
2
1
2
μ
.
=
+
=
×
+
=
×
m m
m
m
m
C O
C
O
p
12 16
12 16
6 06 ( .
)
.
1 67 10
1 14 10
27
26
×
=
×
−
−
kg
kg
ω
μ
=
k
μ
μ
=
+
=
+
m m
m m
m
m
1
2
1 2
1
2
1
1
1
or
ω =
k
m
CHAPTER 11
VIBRATIONAL MOTION
231
9781405124362_4_011.qxd 4/29/08 9:11 Page 231