

252
E. Salameh et al.
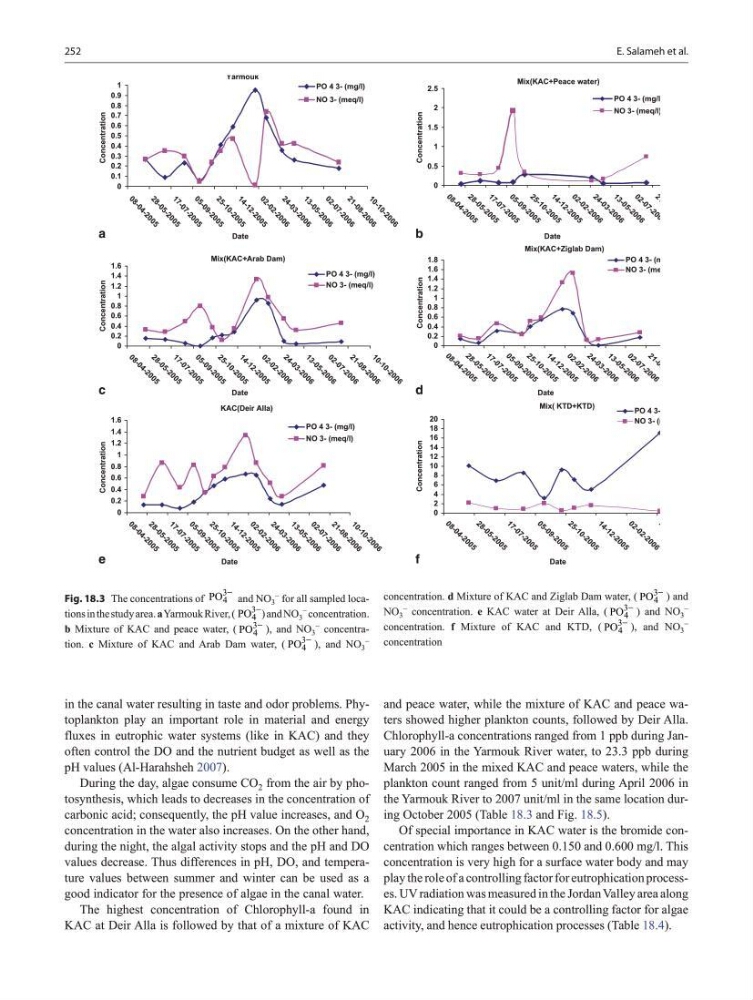
Fig. 18.3 The concentrations of
3
4
PO
− and NO 3
− for all sampled locations in the study area. a Yarmouk River, (
3
4
PO
− ) and NO 3
− concentration.
b Mixture of KAC and peace water, (
3
4
PO
− ), and NO 3
− concentration. c Mixture of KAC and Arab Dam water, (
3
4
PO
− ), and NO 3
−
concentration. d Mixture of KAC and Ziglab Dam water, (
3
4
PO
− ) and
NO 3
− concentration. e KAC water at Deir Alla, (
3
4
PO
− ) and NO 3
−
concentration. f Mixture of KAC and KTD, (
3
4
PO
− ), and NO 3
−
concentration
Yarmouk
0
0.1
0.2
0.3
0.4
0.5
0.6
0.7
0.8
0.9
1
0
8
-
0
4
-
2
0
0
5
2
8
-
0
5
-
2
0
0
5
1
7
-
0
7
-
2
0
0
5
0
5
-
0
9
-
2
0
0
5
2 5 - 1 0 - 2 0 0 5
1 4 - 1 2 - 2 0 0 5
0 2 - 0 2 - 2 0 0 6
2 4 - 0 3 - 2 0 0 6
1 3 - 0 5 - 2 0 0 6
0 2 - 0 7 - 2 0 0 6
2 1 - 0 8 - 2 0 0 6
1 0 - 1 0 - 2 0 0 6
Date
Concentration
PO 4 3- (mg/l)
NO 3- (meq/l)
Mix(KAC+Peace water)
0
0.5
1
1.5
2
2.5
0 8 - 0 4 - 2 0 0 5
2 8 - 0 5 - 2 0 0 5
1 7 - 0 7 - 2 0 0 5
0 5 - 0 9 - 2 0 0 5
2 5 - 1 0 - 2 0 0 5
1 4 - 1 2 - 2 0 0 5
0 2 - 0 2 - 2 0 0 6
2 4 - 0 3 - 2 0 0 6
1 3 - 0 5 - 2 0 0 6
0 2 - 0 7 - 2 0 0 6
2 1 - 0 8 - 2 0 0 6
1 0 - 1 0 - 2 0 0 6
Date
Concentration
PO 4 3- (mg/l)
NO 3- (meq/l)
Mix(KAC+Arab Dam)
0
0.2
0.4
0.6
0.8
1
1.2
1.4
1.6
0
8
-
0
4
-
2
0
0
5
2
8
-
0
5
-
2
0
0
5
1
7
-
0
7
-
2
0
0
5
0
5
-
0
9
-
2
0
0
5
2
5
-
1
0
-
2
0
0
5
1
4
-
1
2
-
2
0
0
5
0
2
-
0
2
-
2
0
0
6
2
4
-
0
3
-
2
0
0
6
1
3
-
0
5
-
2
0
0
6
0
2
-
0
7
-
2
0
0
6
2
1
-
0
8
-
2
0
0
6
1 0 - 1 0 - 2 0 0 6
Date
Concentration
PO 4 3- (mg/l)
NO 3- (meq/l)
Mix(KAC+Ziglab Dam)
0
0.2
0.4
0.6
0.8
1
1.2
1.4
1.6
1.8
0 8 - 0 4 - 2 0 0 5
2 8 - 0 5 - 2 0 0 5
1 7 - 0 7 - 2 0 0 5
0 5 - 0 9 - 2 0 0 5
2 5 - 1 0 - 2 0 0 5
1 4 - 1 2 - 2 0 0 5
0 2 - 0 2 - 2 0 0 6
2 4 - 0 3 - 2 0 0 6
1 3 - 0 5 - 2 0 0 6
0 2 - 0 7 - 2 0 0 6
2 1 - 0 8 - 2 0 0 6
1 0 - 1 0 - 2 0 0 6
Date
Concentration
PO 4 3- (mg/l)
NO 3- (meq/l)
KAC(Deir Alla)
0
0.2
0.4
0.6
0.8
1
1.2
1.4
1.6
0
8
-
0
4
-
2
0
0
5
2
8
-
0
5
-
2
0
0
5
1
7
-
0
7
-
2
0
0
5
0
5
-
0
9
-
2
0
0
5
2
5
-
1
0
-
2
0
0
5
1
4
-
1
2
-
2
0
0
5
0
2
-
0
2
-
2
0
0
6
2
4
-
0
3
-
2
0
0
6
1
3
-
0
5
-
2
0
0
6
0
2
-
0
7
-
2
0
0
6
2
1
-
0
8
-
2
0
0
6
1
0
-
1
0
-
2
0
0
6
Date
Concentration
PO 4 3- (mg/l)
NO 3- (meq/l)
Mix( KTD+KTD)
0
2
4
6
8
10
12
14
16
18
20
0
8
-
0
4
-
2
0
0
5
2
8
-
0
5
-
2
0
0
5
1
7
-
0
7
-
2
0
0
5
0 5 - 0 9 - 2 0 0 5
2 5 - 1 0 - 2 0 0 5
1 4 - 1 2 - 2 0 0 5
0 2 - 0 2 - 2 0 0 6
2 4 - 0 3 - 2 0 0 6
1 3 - 0 5 - 2 0 0 6
Date
Concentration
PO 4 3- (mg/l)
NO 3- (meq/l)
a
c
e
b
d
f
in the canal water resulting in taste and odor problems. Phytoplankton play an important role in material and energy
fluxes in eutrophic water systems (like in KAC) and they
often control the DO and the nutrient budget as well as the
pH values (Al-Harahsheh 2007).
During the day, algae consume CO 2 from the air by photosynthesis, which leads to decreases in the concentration of
carbonic acid; consequently, the pH value increases, and O 2
concentration in the water also increases. On the other hand,
during the night, the algal activity stops and the pH and DO
values decrease. Thus differences in pH, DO, and temperature values between summer and winter can be used as a
good indicator for the presence of algae in the canal water.
The highest concentration of Chlorophyll-a found in
KAC at Deir Alla is followed by that of a mixture of KAC
and peace water, while the mixture of KAC and peace waters showed higher plankton counts, followed by Deir Alla.
Chlorophyll-a concentrations ranged from 1 ppb during January 2006 in the Yarmouk River water, to 23.3 ppb during
March 2005 in the mixed KAC and peace waters, while the
plankton count ranged from 5 unit/ml during April 2006 in
the Yarmouk River to 2007 unit/ml in the same location during October 2005 (Table 18.3 and Fig. 18.5).
Of special importance in KAC water is the bromide concentration which ranges between 0.150 and 0.600 mg/l. This
concentration is very high for a surface water body and may
play the role of a controlling factor for eutrophication processes. UV radiation was measured in the Jordan Valley area along
KAC indicating that it could be a controlling factor for algae
activity, and hence eutrophication processes (Table 18.4).
E. Salameh et al.
Fig. 18.3 The concentrations of
3
4
PO
− and NO 3
− for all sampled locations in the study area. a Yarmouk River, (
3
4
PO
− ) and NO 3
− concentration.
b Mixture of KAC and peace water, (
3
4
PO
− ), and NO 3
− concentration. c Mixture of KAC and Arab Dam water, (
3
4
PO
− ), and NO 3
−
concentration. d Mixture of KAC and Ziglab Dam water, (
3
4
PO
− ) and
NO 3
− concentration. e KAC water at Deir Alla, (
3
4
PO
− ) and NO 3
−
concentration. f Mixture of KAC and KTD, (
3
4
PO
− ), and NO 3
−
concentration
Yarmouk
0
0.1
0.2
0.3
0.4
0.5
0.6
0.7
0.8
0.9
1
0
8
-
0
4
-
2
0
0
5
2
8
-
0
5
-
2
0
0
5
1
7
-
0
7
-
2
0
0
5
0
5
-
0
9
-
2
0
0
5
2 5 - 1 0 - 2 0 0 5
1 4 - 1 2 - 2 0 0 5
0 2 - 0 2 - 2 0 0 6
2 4 - 0 3 - 2 0 0 6
1 3 - 0 5 - 2 0 0 6
0 2 - 0 7 - 2 0 0 6
2 1 - 0 8 - 2 0 0 6
1 0 - 1 0 - 2 0 0 6
Date
Concentration
PO 4 3- (mg/l)
NO 3- (meq/l)
Mix(KAC+Peace water)
0
0.5
1
1.5
2
2.5
0 8 - 0 4 - 2 0 0 5
2 8 - 0 5 - 2 0 0 5
1 7 - 0 7 - 2 0 0 5
0 5 - 0 9 - 2 0 0 5
2 5 - 1 0 - 2 0 0 5
1 4 - 1 2 - 2 0 0 5
0 2 - 0 2 - 2 0 0 6
2 4 - 0 3 - 2 0 0 6
1 3 - 0 5 - 2 0 0 6
0 2 - 0 7 - 2 0 0 6
2 1 - 0 8 - 2 0 0 6
1 0 - 1 0 - 2 0 0 6
Date
Concentration
PO 4 3- (mg/l)
NO 3- (meq/l)
Mix(KAC+Arab Dam)
0
0.2
0.4
0.6
0.8
1
1.2
1.4
1.6
0
8
-
0
4
-
2
0
0
5
2
8
-
0
5
-
2
0
0
5
1
7
-
0
7
-
2
0
0
5
0
5
-
0
9
-
2
0
0
5
2
5
-
1
0
-
2
0
0
5
1
4
-
1
2
-
2
0
0
5
0
2
-
0
2
-
2
0
0
6
2
4
-
0
3
-
2
0
0
6
1
3
-
0
5
-
2
0
0
6
0
2
-
0
7
-
2
0
0
6
2
1
-
0
8
-
2
0
0
6
1 0 - 1 0 - 2 0 0 6
Date
Concentration
PO 4 3- (mg/l)
NO 3- (meq/l)
Mix(KAC+Ziglab Dam)
0
0.2
0.4
0.6
0.8
1
1.2
1.4
1.6
1.8
0 8 - 0 4 - 2 0 0 5
2 8 - 0 5 - 2 0 0 5
1 7 - 0 7 - 2 0 0 5
0 5 - 0 9 - 2 0 0 5
2 5 - 1 0 - 2 0 0 5
1 4 - 1 2 - 2 0 0 5
0 2 - 0 2 - 2 0 0 6
2 4 - 0 3 - 2 0 0 6
1 3 - 0 5 - 2 0 0 6
0 2 - 0 7 - 2 0 0 6
2 1 - 0 8 - 2 0 0 6
1 0 - 1 0 - 2 0 0 6
Date
Concentration
PO 4 3- (mg/l)
NO 3- (meq/l)
KAC(Deir Alla)
0
0.2
0.4
0.6
0.8
1
1.2
1.4
1.6
0
8
-
0
4
-
2
0
0
5
2
8
-
0
5
-
2
0
0
5
1
7
-
0
7
-
2
0
0
5
0
5
-
0
9
-
2
0
0
5
2
5
-
1
0
-
2
0
0
5
1
4
-
1
2
-
2
0
0
5
0
2
-
0
2
-
2
0
0
6
2
4
-
0
3
-
2
0
0
6
1
3
-
0
5
-
2
0
0
6
0
2
-
0
7
-
2
0
0
6
2
1
-
0
8
-
2
0
0
6
1
0
-
1
0
-
2
0
0
6
Date
Concentration
PO 4 3- (mg/l)
NO 3- (meq/l)
Mix( KTD+KTD)
0
2
4
6
8
10
12
14
16
18
20
0
8
-
0
4
-
2
0
0
5
2
8
-
0
5
-
2
0
0
5
1
7
-
0
7
-
2
0
0
5
0 5 - 0 9 - 2 0 0 5
2 5 - 1 0 - 2 0 0 5
1 4 - 1 2 - 2 0 0 5
0 2 - 0 2 - 2 0 0 6
2 4 - 0 3 - 2 0 0 6
1 3 - 0 5 - 2 0 0 6
Date
Concentration
PO 4 3- (mg/l)
NO 3- (meq/l)
a
c
e
b
d
f
in the canal water resulting in taste and odor problems. Phytoplankton play an important role in material and energy
fluxes in eutrophic water systems (like in KAC) and they
often control the DO and the nutrient budget as well as the
pH values (Al-Harahsheh 2007).
During the day, algae consume CO 2 from the air by photosynthesis, which leads to decreases in the concentration of
carbonic acid; consequently, the pH value increases, and O 2
concentration in the water also increases. On the other hand,
during the night, the algal activity stops and the pH and DO
values decrease. Thus differences in pH, DO, and temperature values between summer and winter can be used as a
good indicator for the presence of algae in the canal water.
The highest concentration of Chlorophyll-a found in
KAC at Deir Alla is followed by that of a mixture of KAC
and peace water, while the mixture of KAC and peace waters showed higher plankton counts, followed by Deir Alla.
Chlorophyll-a concentrations ranged from 1 ppb during January 2006 in the Yarmouk River water, to 23.3 ppb during
March 2005 in the mixed KAC and peace waters, while the
plankton count ranged from 5 unit/ml during April 2006 in
the Yarmouk River to 2007 unit/ml in the same location during October 2005 (Table 18.3 and Fig. 18.5).
Of special importance in KAC water is the bromide concentration which ranges between 0.150 and 0.600 mg/l. This
concentration is very high for a surface water body and may
play the role of a controlling factor for eutrophication processes. UV radiation was measured in the Jordan Valley area along
KAC indicating that it could be a controlling factor for algae
activity, and hence eutrophication processes (Table 18.4).