

218
S. Sánchez-Carrillo et al.
areas promote the prevalence of generalist microbial communities (i.e., no difference in resource allocation) while
reference sites increased specialist communities (Table 15.2;
Corstanje et al. 2007). Large shifts in N and P dynamics have
also been observed between enriched and reference sites by
Penton and Newman (2007) using E C /E P and E C /E N ratios
(Fig. 15.9). Both studies suggest the existence of an environmental threshold on total P concentration below which
changes in enzyme-based resource allocation will not occur.
Concurrently with E C /E P and E C /E N , in this latter study the
E C /E OX values were examined to assess the effects of nutrient enrichment on lignin degradation. Small increases
in E C /E OX values were measured in nutrient-enriched sites
which might indicate an apparent reduction of lignin control
on C mineralization. The repression of phenol oxidase activity could be attributed to either the greater N availability
(higher E C /E N values) coming from exogenous sources and
the lower oxygen availability in the nutrient-enriched areas.
15.9 Conclusions
Considering the biogeochemical character of wetlands as
nutrient transformers dominated by the microbial pool activity, this latter scale of changes should be the most appropriate to measure the effects of eutrophication on ecosystem
biogeochemistry stability. Needs and demands of microbial
communities change as nutrient availability is altered. This
is the key to assess the fingerprint of microbial community
responses under wetland eutrophication. The concept of utilizing microbial ecophysiological measures as indicators of
wetland disturbance is particularly reinforced by the shift on
microbial resource allocation associated with nutrient enrichment. Soil nutrient content changes gradually as a result
of the influx of nutrients while soil microbial measures such
as enzyme activity exhibited a threshold response. These
distinct, abrupt changes in microbial community activity as
compared to the more progressive change in the soil chemical characteristics indicate that microbial indicators function
effectively as early warning signals of wetland eutrophication (Corstanje et al. 2007).
Eutrophication in wetlands promotes significant changes
in wetland plant community composition which affect the
litter quality. Microbial responses in turn vary based on litter
quality, the type of electron acceptors present and the microbial community composition. The first symptom of nutrient
enrichment in wetlands is an increase of the microbial biomass resulting in a loss in the nutrient cycling (metabolic)
efficiency because microbial metabolic activity to microbial
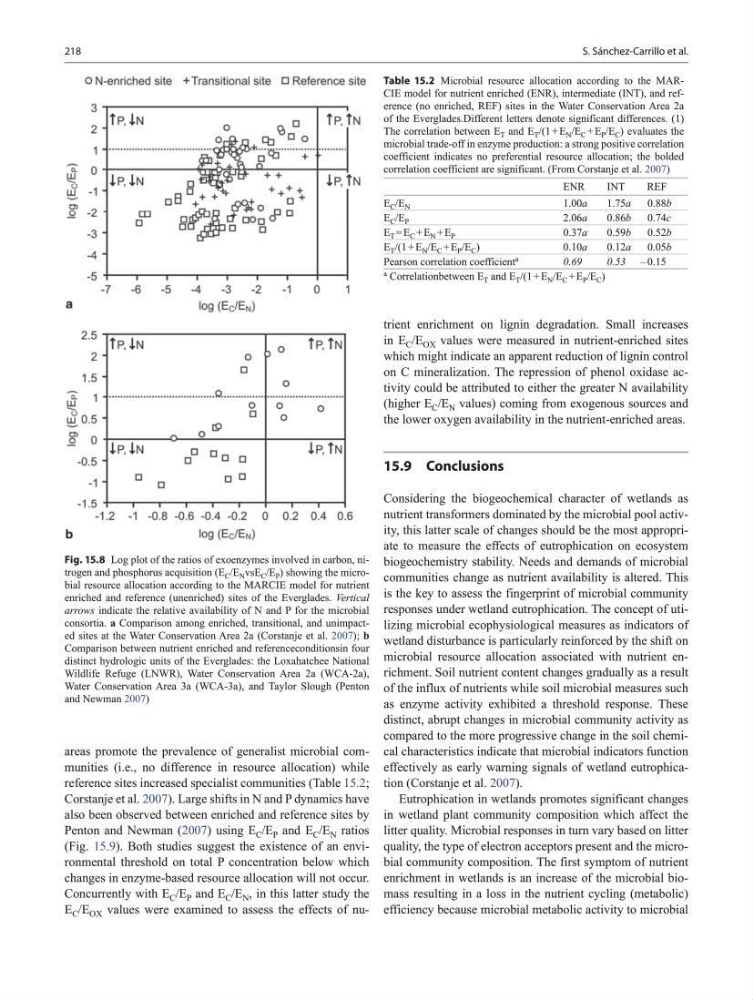
Fig. 15.8 Log plot of the ratios of exoenzymes involved in carbon, nitrogen and phosphorus acquisition (E C /E N vsE C /E P ) showing the microbial resource allocation according to the MARCIE model for nutrient
enriched and reference (unenriched) sites of the Everglades. Vertical
arrows indicate the relative availability of N and P for the microbial
consortia. a Comparison among enriched, transitional, and unimpacted sites at the Water Conservation Area 2a (Corstanje et al. 2007); b
Comparison between nutrient enriched and referenceconditionsin four
distinct hydrologic units of the Everglades: the Loxahatchee National
Wildlife Refuge (LNWR), Water Conservation Area 2a (WCA-2a),
Water Conservation Area 3a (WCA-3a), and Taylor Slough (Penton
and Newman 2007)
Table 15.2 Microbial resource allocation according to the MARCIE model for nutrient enriched (ENR), intermediate (INT), and reference (no enriched, REF) sites in the Water Conservation Area 2a
of the Everglades.Different letters denote significant differences. (1)
The correlation between E T and E T /(1 + E N /E C + E P /E C ) evaluates the
microbial trade-off in enzyme production: a strong positive correlation
coefficient indicates no preferential resource allocation; the bolded
correlation coefficient are significant. (From Corstanje et al. 2007)
ENR
INT
REF
E C /E N
1.00a
1.75a
0.88b
E C /E P
2.06a
0.86b
0.74c
E T = E C + E N + E P
0.37a
0.59b
0.52b
E T /(1 + E N /E C + E P /E C )
0.10a
0.12a
0.05b
Pearson correlation coefficient a
0.69
0.53 – 0.15
a Correlationbetween E T and E T /(1 + E N /E C + E P /E C )
S. Sánchez-Carrillo et al.
areas promote the prevalence of generalist microbial communities (i.e., no difference in resource allocation) while
reference sites increased specialist communities (Table 15.2;
Corstanje et al. 2007). Large shifts in N and P dynamics have
also been observed between enriched and reference sites by
Penton and Newman (2007) using E C /E P and E C /E N ratios
(Fig. 15.9). Both studies suggest the existence of an environmental threshold on total P concentration below which
changes in enzyme-based resource allocation will not occur.
Concurrently with E C /E P and E C /E N , in this latter study the
E C /E OX values were examined to assess the effects of nutrient enrichment on lignin degradation. Small increases
in E C /E OX values were measured in nutrient-enriched sites
which might indicate an apparent reduction of lignin control
on C mineralization. The repression of phenol oxidase activity could be attributed to either the greater N availability
(higher E C /E N values) coming from exogenous sources and
the lower oxygen availability in the nutrient-enriched areas.
15.9 Conclusions
Considering the biogeochemical character of wetlands as
nutrient transformers dominated by the microbial pool activity, this latter scale of changes should be the most appropriate to measure the effects of eutrophication on ecosystem
biogeochemistry stability. Needs and demands of microbial
communities change as nutrient availability is altered. This
is the key to assess the fingerprint of microbial community
responses under wetland eutrophication. The concept of utilizing microbial ecophysiological measures as indicators of
wetland disturbance is particularly reinforced by the shift on
microbial resource allocation associated with nutrient enrichment. Soil nutrient content changes gradually as a result
of the influx of nutrients while soil microbial measures such
as enzyme activity exhibited a threshold response. These
distinct, abrupt changes in microbial community activity as
compared to the more progressive change in the soil chemical characteristics indicate that microbial indicators function
effectively as early warning signals of wetland eutrophication (Corstanje et al. 2007).
Eutrophication in wetlands promotes significant changes
in wetland plant community composition which affect the
litter quality. Microbial responses in turn vary based on litter
quality, the type of electron acceptors present and the microbial community composition. The first symptom of nutrient
enrichment in wetlands is an increase of the microbial biomass resulting in a loss in the nutrient cycling (metabolic)
efficiency because microbial metabolic activity to microbial
Fig. 15.8 Log plot of the ratios of exoenzymes involved in carbon, nitrogen and phosphorus acquisition (E C /E N vsE C /E P ) showing the microbial resource allocation according to the MARCIE model for nutrient
enriched and reference (unenriched) sites of the Everglades. Vertical
arrows indicate the relative availability of N and P for the microbial
consortia. a Comparison among enriched, transitional, and unimpacted sites at the Water Conservation Area 2a (Corstanje et al. 2007); b
Comparison between nutrient enriched and referenceconditionsin four
distinct hydrologic units of the Everglades: the Loxahatchee National
Wildlife Refuge (LNWR), Water Conservation Area 2a (WCA-2a),
Water Conservation Area 3a (WCA-3a), and Taylor Slough (Penton
and Newman 2007)
Table 15.2 Microbial resource allocation according to the MARCIE model for nutrient enriched (ENR), intermediate (INT), and reference (no enriched, REF) sites in the Water Conservation Area 2a
of the Everglades.Different letters denote significant differences. (1)
The correlation between E T and E T /(1 + E N /E C + E P /E C ) evaluates the
microbial trade-off in enzyme production: a strong positive correlation
coefficient indicates no preferential resource allocation; the bolded
correlation coefficient are significant. (From Corstanje et al. 2007)
ENR
INT
REF
E C /E N
1.00a
1.75a
0.88b
E C /E P
2.06a
0.86b
0.74c
E T = E C + E N + E P
0.37a
0.59b
0.52b
E T /(1 + E N /E C + E P /E C )
0.10a
0.12a
0.05b
Pearson correlation coefficient a
0.69
0.53 – 0.15
a Correlationbetween E T and E T /(1 + E N /E C + E P /E C )