

208
S. Sánchez-Carrillo et al.
picture of the soil microbial community. PLFA analysis involves the extraction and analysis of phospholipids from microbial cell walls and have been used to measure microbial
biodiversity, metabolic status (starved vs. metabolically active cells) and relative abundance of microbial groups (fungi,
bacteria, Gram positive, Gram negative, methanotrophs, and
sulfate-reducing bacteria; Vestal and White 1989; Zak et al.
1994; Frostegard and Baath 1996). Among the lipid biomarkers, relative increases in abundance of monosaturated
fatty acids and decline in branched fatty acids are proposed
indicators of high substrate (C) availability in paddy soils
(Bossio and Scow 1997). Changes in metabolic status of the
soil microbial community and community structure cooccur.
Some lipid ratios have been used as sensitive indicators of
nutritional stress (Tunlid and White 1992). The accumulation
of poly-beta 0 hydroxyalkanoic (PHA) storage compounds
relative to PLFA indicates unbalanced prokaryotic growth.
In presence of toxicants the ratio of trans monoenoic PLFA
increases relative to their cis homologues. Unfavorable conditions for bacterial growth and the starvation survival mode
are indicated by the cyclopropane fatty acids and the ratio of
increased saturated to unsaturated fatty acids, respectively
(Tunlid and White 1992; Kieft et al. 1994).
Spatial and temporal changes in microbial functional diversity have also been assessed by determining the physiological profiles at community level (CLPP; Garland and
Mills 1994). This culture-based approach measures carbon
utilization patterns (BIOLOG method) of the heterotrophic
microbial communities (Zak et al. 1994). Highly polluted
areas in coastal marshes and polluted river sediments have
been characterized with high abundance of microorganisms
with low functional diversity (Costa et al. 2007; Jacinthe
et al. 2010).
15.5 Organic Matter Mineralization and
Nutrient Enrichment in Wetlands
Nutrient enrichment has been noted to generally increase
organic matter mineralization rates in wetland soils (Davis
1991; Qualls and Richardson 2000), including the mineralization of P. The combination of nutrient availability and
changes in the litter source resulted in a shift in litter quality
and quantity (Davis 1991; DeBusk and Reddy 1998), with
significant increases in carbon- (DeBusk and Reddy 1998),
nitrogen- (White and Reddy 2000; Newman et al. 2001) and
phosphorus mineralization rates (Newman et al. 2001). The
rates of microbially mediated organic matter degradation not
only play a pivotal role in nutrient regeneration (Newman
et al. 2001), but are also known to respond to numerous environmental perturbations such as eutrophication, modifying
ecosystem processes and hence wetland ecosystem structure
and functioning.
15.5.1 Aerobic and Anaerobic Metabolic
Activities in Wetland Soils Exposed to
Nutrient Enrichment
A number of investigations have found significant correlations between microbial respiration rates (see Box 2 for incubation methods) in wetland soils and nutrient availability
(McKinley and Vestal 1992; Amador and Jones 1993; Aerts
and Toet 1997), pH, temperature (Westermann and Ahring
1987; Bridgham and Richardson 1992; Prieme 1994) and
electron donors (Burford and Bremner 1975; Yavitt and
Lang 1990; Jorgensen and Richter 1992; Crozier et al. 1995;
D’Angelo and Reddy 1999; Wright and Reddy 2001). Electron acceptor and donor availability have been found to be
dominant in regulating potential rates and modes of organic
carbon mineralization in wetland soils (D’Angelo and Reddy
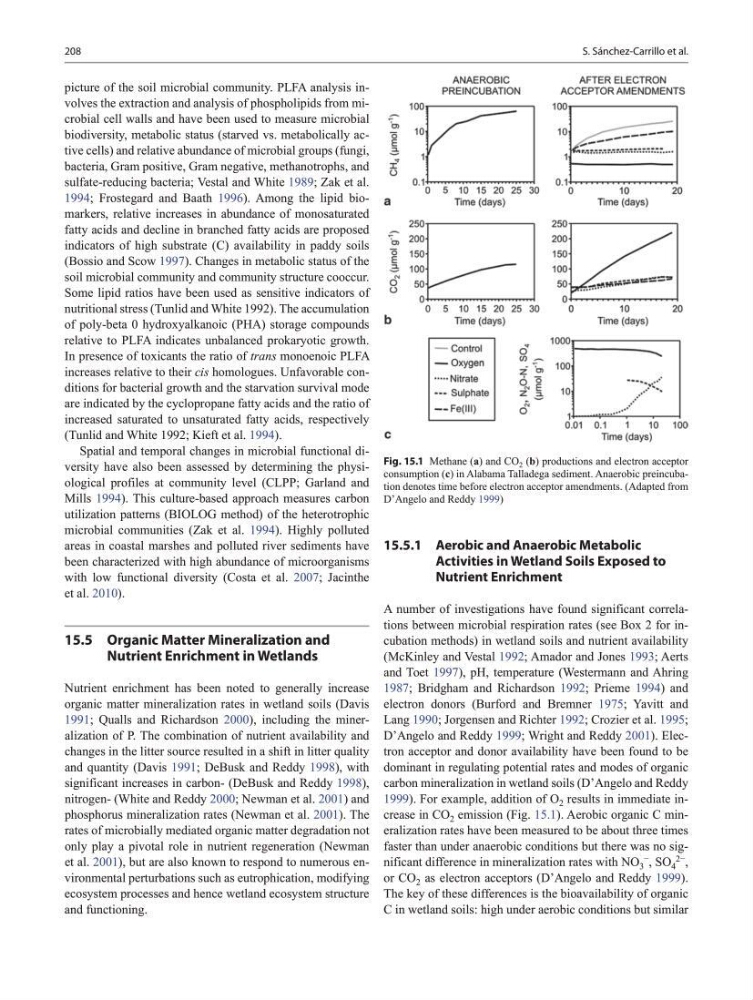
1999). For example, addition of O 2 results in immediate increase in CO 2 emission (Fig. 15.1). Aerobic organic C mineralization rates have been measured to be about three times
faster than under anaerobic conditions but there was no significant difference in mineralization rates with NO 3
− , SO 4
2− ,
or CO 2 as electron acceptors (D’Angelo and Reddy 1999).
The key of these differences is the bioavailability of organic
C in wetland soils: high under aerobic conditions but similar
Fig. 15.1 Methane (a) and CO 2 (b) productions and electron acceptor
consumption (c) in Alabama Talladega sediment. Anaerobic preincubation denotes time before electron acceptor amendments. (Adapted from
D’Angelo and Reddy 1999)
S. Sánchez-Carrillo et al.
picture of the soil microbial community. PLFA analysis involves the extraction and analysis of phospholipids from microbial cell walls and have been used to measure microbial
biodiversity, metabolic status (starved vs. metabolically active cells) and relative abundance of microbial groups (fungi,
bacteria, Gram positive, Gram negative, methanotrophs, and
sulfate-reducing bacteria; Vestal and White 1989; Zak et al.
1994; Frostegard and Baath 1996). Among the lipid biomarkers, relative increases in abundance of monosaturated
fatty acids and decline in branched fatty acids are proposed
indicators of high substrate (C) availability in paddy soils
(Bossio and Scow 1997). Changes in metabolic status of the
soil microbial community and community structure cooccur.
Some lipid ratios have been used as sensitive indicators of
nutritional stress (Tunlid and White 1992). The accumulation
of poly-beta 0 hydroxyalkanoic (PHA) storage compounds
relative to PLFA indicates unbalanced prokaryotic growth.
In presence of toxicants the ratio of trans monoenoic PLFA
increases relative to their cis homologues. Unfavorable conditions for bacterial growth and the starvation survival mode
are indicated by the cyclopropane fatty acids and the ratio of
increased saturated to unsaturated fatty acids, respectively
(Tunlid and White 1992; Kieft et al. 1994).
Spatial and temporal changes in microbial functional diversity have also been assessed by determining the physiological profiles at community level (CLPP; Garland and
Mills 1994). This culture-based approach measures carbon
utilization patterns (BIOLOG method) of the heterotrophic
microbial communities (Zak et al. 1994). Highly polluted
areas in coastal marshes and polluted river sediments have
been characterized with high abundance of microorganisms
with low functional diversity (Costa et al. 2007; Jacinthe
et al. 2010).
15.5 Organic Matter Mineralization and
Nutrient Enrichment in Wetlands
Nutrient enrichment has been noted to generally increase
organic matter mineralization rates in wetland soils (Davis
1991; Qualls and Richardson 2000), including the mineralization of P. The combination of nutrient availability and
changes in the litter source resulted in a shift in litter quality
and quantity (Davis 1991; DeBusk and Reddy 1998), with
significant increases in carbon- (DeBusk and Reddy 1998),
nitrogen- (White and Reddy 2000; Newman et al. 2001) and
phosphorus mineralization rates (Newman et al. 2001). The
rates of microbially mediated organic matter degradation not
only play a pivotal role in nutrient regeneration (Newman
et al. 2001), but are also known to respond to numerous environmental perturbations such as eutrophication, modifying
ecosystem processes and hence wetland ecosystem structure
and functioning.
15.5.1 Aerobic and Anaerobic Metabolic
Activities in Wetland Soils Exposed to
Nutrient Enrichment
A number of investigations have found significant correlations between microbial respiration rates (see Box 2 for incubation methods) in wetland soils and nutrient availability
(McKinley and Vestal 1992; Amador and Jones 1993; Aerts
and Toet 1997), pH, temperature (Westermann and Ahring
1987; Bridgham and Richardson 1992; Prieme 1994) and
electron donors (Burford and Bremner 1975; Yavitt and
Lang 1990; Jorgensen and Richter 1992; Crozier et al. 1995;
D’Angelo and Reddy 1999; Wright and Reddy 2001). Electron acceptor and donor availability have been found to be
dominant in regulating potential rates and modes of organic
carbon mineralization in wetland soils (D’Angelo and Reddy
1999). For example, addition of O 2 results in immediate increase in CO 2 emission (Fig. 15.1). Aerobic organic C mineralization rates have been measured to be about three times
faster than under anaerobic conditions but there was no significant difference in mineralization rates with NO 3
− , SO 4
2− ,
or CO 2 as electron acceptors (D’Angelo and Reddy 1999).
The key of these differences is the bioavailability of organic
C in wetland soils: high under aerobic conditions but similar
Fig. 15.1 Methane (a) and CO 2 (b) productions and electron acceptor
consumption (c) in Alabama Talladega sediment. Anaerobic preincubation denotes time before electron acceptor amendments. (Adapted from
D’Angelo and Reddy 1999)