

201
14 Phytoplankton Assemblages as an Indicator of Water Quality in Seven Temperate Estuarine Lakes in South-East Australia
These results suggest that human activity within the catchment may impact on water quality and therefore the phytoplankton communities. Moreover, some specific information
was found in the stepwise multilinear regression between
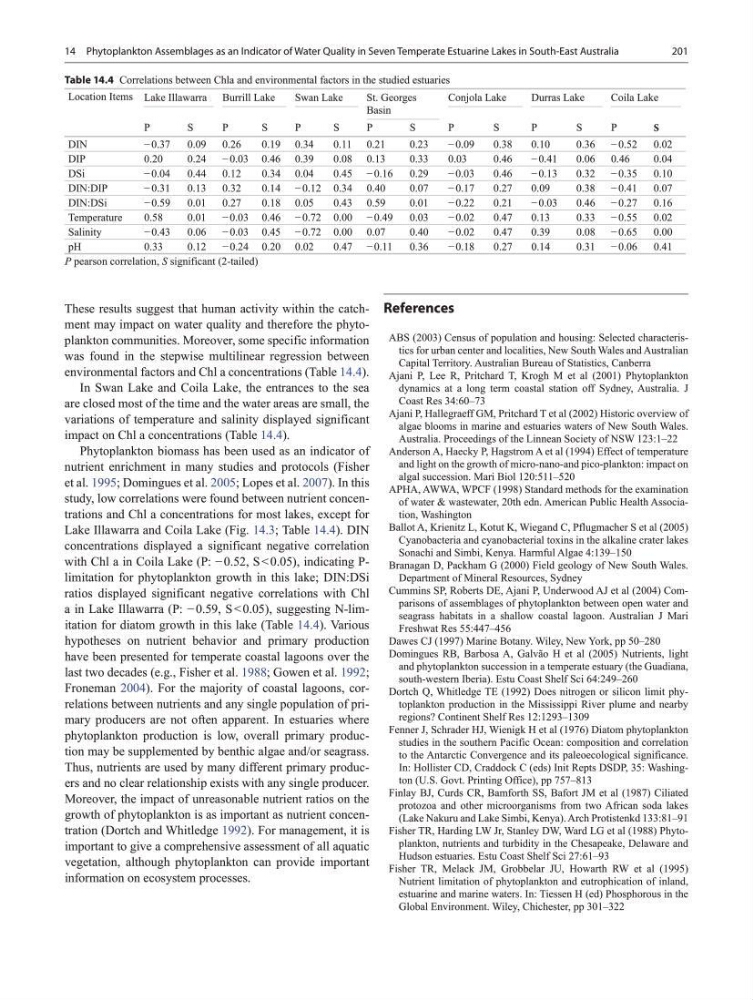
environmental factors and Chl a concentrations (Table 14.4).
In Swan Lake and Coila Lake, the entrances to the sea
are closed most of the time and the water areas are small, the
variations of temperature and salinity displayed significant
impact on Chl a concentrations (Table 14.4).
Phytoplankton biomass has been used as an indicator of
nutrient enrichment in many studies and protocols (Fisher
et al. 1995; Domingues et al. 2005; Lopes et al. 2007). In this
study, low correlations were found between nutrient concentrations and Chl a concentrations for most lakes, except for
Lake Illawarra and Coila Lake (Fig. 14.3; Table 14.4). DIN
concentrations displayed a significant negative correlation
with Chl a in Coila Lake (P: − 0.52, S < 0.05), indicating Plimitation for phytoplankton growth in this lake; DIN:DSi
ratios displayed significant negative correlations with Chl
a in Lake Illawarra (P: − 0.59, S < 0.05), suggesting N-limitation for diatom growth in this lake (Table 14.4). Various
hypotheses on nutrient behavior and primary production
have been presented for temperate coastal lagoons over the
last two decades (e.g., Fisher et al. 1988; Gowen et al. 1992;
Froneman 2004). For the majority of coastal lagoons, correlations between nutrients and any single population of primary producers are not often apparent. In estuaries where
phytoplankton production is low, overall primary production may be supplemented by benthic algae and/or seagrass.
Thus, nutrients are used by many different primary producers and no clear relationship exists with any single producer.
Moreover, the impact of unreasonable nutrient ratios on the
growth of phytoplankton is as important as nutrient concentration (Dortch and Whitledge 1992). For management, it is
important to give a comprehensive assessment of all aquatic
vegetation, although phytoplankton can provide important
information on ecosystem processes.
References
ABS (2003) Census of population and housing: Selected characteristics for urban center and localities, New South Wales and Australian
Capital Territory. Australian Bureau of Statistics, Canberra
Ajani P, Lee R, Pritchard T, Krogh M et al (2001) Phytoplankton
dynamics at a long term coastal station off Sydney, Australia. J
Coast Res 34:60–73
Ajani P, Hallegraeff GM, Pritchard T et al (2002) Historic overview of
algae blooms in marine and estuaries waters of New South Wales.
Australia. Proceedings of the Linnean Society of NSW 123:1–22
Anderson A, Haecky P, Hagstrom A et al (1994) Effect of temperature
and light on the growth of micro-nano-and pico-plankton: impact on
algal succession. Mari Biol 120:511–520
APHA, AWWA, WPCF (1998) Standard methods for the examination
of water & wastewater, 20th edn. American Public Health Association, Washington
Ballot A, Krienitz L, Kotut K, Wiegand C, Pflugmacher S et al (2005)
Cyanobacteria and cyanobacterial toxins in the alkaline crater lakes
Sonachi and Simbi, Kenya. Harmful Algae 4:139–150
Branagan D, Packham G (2000) Field geology of New South Wales.
Department of Mineral Resources, Sydney
Cummins SP, Roberts DE, Ajani P, Underwood AJ et al (2004) Comparisons of assemblages of phytoplankton between open water and
seagrass habitats in a shallow coastal lagoon. Australian J Mari
Freshwat Res 55:447–456
Dawes CJ (1997) Marine Botany. Wiley, New York, pp 50–280
Domingues RB, Barbosa A, Galvão H et al (2005) Nutrients, light
and phytoplankton succession in a temperate estuary (the Guadiana,
south-western Iberia). Estu Coast Shelf Sci 64:249–260
Dortch Q, Whitledge TE (1992) Does nitrogen or silicon limit phytoplankton production in the Mississippi River plume and nearby
regions? Continent Shelf Res 12:1293–1309
Fenner J, Schrader HJ, Wienigk H et al (1976) Diatom phytoplankton
studies in the southern Pacific Ocean: composition and correlation
to the Antarctic Convergence and its paleoecological significance.
In: Hollister CD, Craddock C (eds) Init Repts DSDP, 35: Washington (U.S. Govt. Printing Office), pp 757–813
Finlay BJ, Curds CR, Bamforth SS, Bafort JM et al (1987) Ciliated
protozoa and other microorganisms from two African soda lakes
(Lake Nakuru and Lake Simbi, Kenya). Arch Protistenkd 133:81–91
Fisher TR, Harding LW Jr, Stanley DW, Ward LG et al (1988) Phytoplankton, nutrients and turbidity in the Chesapeake, Delaware and
Hudson estuaries. Estu Coast Shelf Sci 27:61–93
Fisher TR, Melack JM, Grobbelar JU, Howarth RW et al (1995)
Nutrient limitation of phytoplankton and eutrophication of inland,
estuarine and marine waters. In: Tiessen H (ed) Phosphorous in the
Global Environment. Wiley, Chichester, pp 301–322
Table 14.4 Correlations between Chla and environmental factors in the studied estuaries
Location Items Lake Illawarra Burrill Lake
Swan Lake
St. Georges
Basin
Conjola Lake
Durras Lake
Coila Lake
P
S
P
S
P
S
P
S
P
S
P
S
P
S
DIN
− 0.37
0.09
0.26
0.19 0.34
0.11 0.21
0.23
− 0.09
0.38
0.10
0.36 − 0.52
0.02
DIP
0.20
0.24
− 0.03 0.46 0.39
0.08 0.13
0.33
0.03
0.46
− 0.41
0.06 0.46
0.04
DSi
− 0.04
0.44
0.12
0.34 0.04
0.45 − 0.16
0.29
− 0.03
0.46
− 0.13
0.32 − 0.35
0.10
DIN:DIP
− 0.31
0.13
0.32
0.14 − 0.12 0.34 0.40
0.07
− 0.17
0.27
0.09
0.38 − 0.41
0.07
DIN:DSi
− 0.59
0.01
0.27
0.18 0.05
0.43 0.59
0.01
− 0.22
0.21
− 0.03
0.46 − 0.27
0.16
Temperature
0.58
0.01
− 0.03 0.46 − 0.72 0.00 − 0.49
0.03
− 0.02
0.47
0.13
0.33 − 0.55
0.02
Salinity
− 0.43
0.06
− 0.03 0.45 − 0.72 0.00 0.07
0.40
− 0.02
0.47
0.39
0.08 − 0.65
0.00
pH
0.33
0.12
− 0.24 0.20 0.02
0.47 − 0.11
0.36
− 0.18
0.27
0.14
0.31 − 0.06
0.41
P pearson correlation, S significant (2-tailed)
14 Phytoplankton Assemblages as an Indicator of Water Quality in Seven Temperate Estuarine Lakes in South-East Australia
These results suggest that human activity within the catchment may impact on water quality and therefore the phytoplankton communities. Moreover, some specific information
was found in the stepwise multilinear regression between
environmental factors and Chl a concentrations (Table 14.4).
In Swan Lake and Coila Lake, the entrances to the sea
are closed most of the time and the water areas are small, the
variations of temperature and salinity displayed significant
impact on Chl a concentrations (Table 14.4).
Phytoplankton biomass has been used as an indicator of
nutrient enrichment in many studies and protocols (Fisher
et al. 1995; Domingues et al. 2005; Lopes et al. 2007). In this
study, low correlations were found between nutrient concentrations and Chl a concentrations for most lakes, except for
Lake Illawarra and Coila Lake (Fig. 14.3; Table 14.4). DIN
concentrations displayed a significant negative correlation
with Chl a in Coila Lake (P: − 0.52, S < 0.05), indicating Plimitation for phytoplankton growth in this lake; DIN:DSi
ratios displayed significant negative correlations with Chl
a in Lake Illawarra (P: − 0.59, S < 0.05), suggesting N-limitation for diatom growth in this lake (Table 14.4). Various
hypotheses on nutrient behavior and primary production
have been presented for temperate coastal lagoons over the
last two decades (e.g., Fisher et al. 1988; Gowen et al. 1992;
Froneman 2004). For the majority of coastal lagoons, correlations between nutrients and any single population of primary producers are not often apparent. In estuaries where
phytoplankton production is low, overall primary production may be supplemented by benthic algae and/or seagrass.
Thus, nutrients are used by many different primary producers and no clear relationship exists with any single producer.
Moreover, the impact of unreasonable nutrient ratios on the
growth of phytoplankton is as important as nutrient concentration (Dortch and Whitledge 1992). For management, it is
important to give a comprehensive assessment of all aquatic
vegetation, although phytoplankton can provide important
information on ecosystem processes.
References
ABS (2003) Census of population and housing: Selected characteristics for urban center and localities, New South Wales and Australian
Capital Territory. Australian Bureau of Statistics, Canberra
Ajani P, Lee R, Pritchard T, Krogh M et al (2001) Phytoplankton
dynamics at a long term coastal station off Sydney, Australia. J
Coast Res 34:60–73
Ajani P, Hallegraeff GM, Pritchard T et al (2002) Historic overview of
algae blooms in marine and estuaries waters of New South Wales.
Australia. Proceedings of the Linnean Society of NSW 123:1–22
Anderson A, Haecky P, Hagstrom A et al (1994) Effect of temperature
and light on the growth of micro-nano-and pico-plankton: impact on
algal succession. Mari Biol 120:511–520
APHA, AWWA, WPCF (1998) Standard methods for the examination
of water & wastewater, 20th edn. American Public Health Association, Washington
Ballot A, Krienitz L, Kotut K, Wiegand C, Pflugmacher S et al (2005)
Cyanobacteria and cyanobacterial toxins in the alkaline crater lakes
Sonachi and Simbi, Kenya. Harmful Algae 4:139–150
Branagan D, Packham G (2000) Field geology of New South Wales.
Department of Mineral Resources, Sydney
Cummins SP, Roberts DE, Ajani P, Underwood AJ et al (2004) Comparisons of assemblages of phytoplankton between open water and
seagrass habitats in a shallow coastal lagoon. Australian J Mari
Freshwat Res 55:447–456
Dawes CJ (1997) Marine Botany. Wiley, New York, pp 50–280
Domingues RB, Barbosa A, Galvão H et al (2005) Nutrients, light
and phytoplankton succession in a temperate estuary (the Guadiana,
south-western Iberia). Estu Coast Shelf Sci 64:249–260
Dortch Q, Whitledge TE (1992) Does nitrogen or silicon limit phytoplankton production in the Mississippi River plume and nearby
regions? Continent Shelf Res 12:1293–1309
Fenner J, Schrader HJ, Wienigk H et al (1976) Diatom phytoplankton
studies in the southern Pacific Ocean: composition and correlation
to the Antarctic Convergence and its paleoecological significance.
In: Hollister CD, Craddock C (eds) Init Repts DSDP, 35: Washington (U.S. Govt. Printing Office), pp 757–813
Finlay BJ, Curds CR, Bamforth SS, Bafort JM et al (1987) Ciliated
protozoa and other microorganisms from two African soda lakes
(Lake Nakuru and Lake Simbi, Kenya). Arch Protistenkd 133:81–91
Fisher TR, Harding LW Jr, Stanley DW, Ward LG et al (1988) Phytoplankton, nutrients and turbidity in the Chesapeake, Delaware and
Hudson estuaries. Estu Coast Shelf Sci 27:61–93
Fisher TR, Melack JM, Grobbelar JU, Howarth RW et al (1995)
Nutrient limitation of phytoplankton and eutrophication of inland,
estuarine and marine waters. In: Tiessen H (ed) Phosphorous in the
Global Environment. Wiley, Chichester, pp 301–322
Table 14.4 Correlations between Chla and environmental factors in the studied estuaries
Location Items Lake Illawarra Burrill Lake
Swan Lake
St. Georges
Basin
Conjola Lake
Durras Lake
Coila Lake
P
S
P
S
P
S
P
S
P
S
P
S
P
S
DIN
− 0.37
0.09
0.26
0.19 0.34
0.11 0.21
0.23
− 0.09
0.38
0.10
0.36 − 0.52
0.02
DIP
0.20
0.24
− 0.03 0.46 0.39
0.08 0.13
0.33
0.03
0.46
− 0.41
0.06 0.46
0.04
DSi
− 0.04
0.44
0.12
0.34 0.04
0.45 − 0.16
0.29
− 0.03
0.46
− 0.13
0.32 − 0.35
0.10
DIN:DIP
− 0.31
0.13
0.32
0.14 − 0.12 0.34 0.40
0.07
− 0.17
0.27
0.09
0.38 − 0.41
0.07
DIN:DSi
− 0.59
0.01
0.27
0.18 0.05
0.43 0.59
0.01
− 0.22
0.21
− 0.03
0.46 − 0.27
0.16
Temperature
0.58
0.01
− 0.03 0.46 − 0.72 0.00 − 0.49
0.03
− 0.02
0.47
0.13
0.33 − 0.55
0.02
Salinity
− 0.43
0.06
− 0.03 0.45 − 0.72 0.00 0.07
0.40
− 0.02
0.47
0.39
0.08 − 0.65
0.00
pH
0.33
0.12
− 0.24 0.20 0.02
0.47 − 0.11
0.36
− 0.18
0.27
0.14
0.31 − 0.06
0.41
P pearson correlation, S significant (2-tailed)