

194
D. Liu et al.
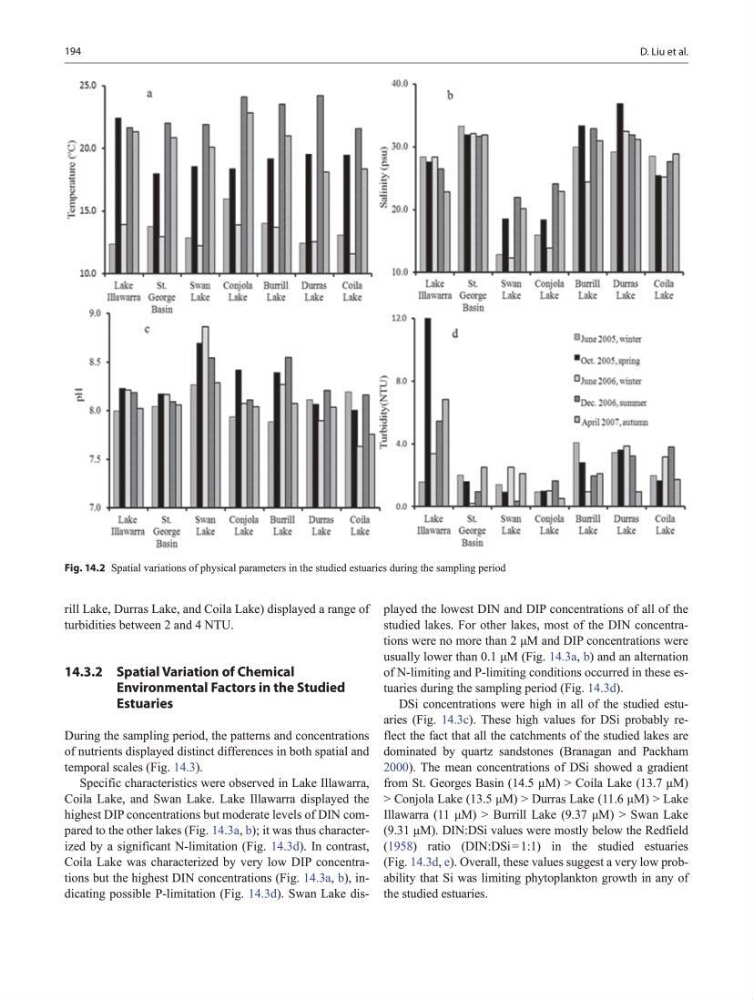
rill Lake, Durras Lake, and Coila Lake) displayed a range of
turbidities between 2 and 4 NTU.
14.3.2 Spatial Variation of Chemical
Environmental Factors in the Studied
Estuaries
During the sampling period, the patterns and concentrations
of nutrients displayed distinct differences in both spatial and
temporal scales (Fig. 14.3).
Specific characteristics were observed in Lake Illawarra,
Coila Lake, and Swan Lake. Lake Illawarra displayed the
highest DIP concentrations but moderate levels of DIN compared to the other lakes (Fig. 14.3a, b); it was thus characterized by a significant N-limitation (Fig. 14.3d). In contrast,
Coila Lake was characterized by very low DIP concentrations but the highest DIN concentrations (Fig. 14.3a, b), indicating possible P-limitation (Fig. 14.3d). Swan Lake displayed the lowest DIN and DIP concentrations of all of the
studied lakes. For other lakes, most of the DIN concentrations were no more than 2 μM and DIP concentrations were
usually lower than 0.1 μM (Fig. 14.3a, b) and an alternation
of N-limiting and P-limiting conditions occurred in these estuaries during the sampling period (Fig. 14.3d).
DSi concentrations were high in all of the studied estuaries (Fig. 14.3c). These high values for DSi probably reflect the fact that all the catchments of the studied lakes are
dominated by quartz sandstones (Branagan and Packham
2000). The mean concentrations of DSi showed a gradient
from St. Georges Basin (14.5 μM) > Coila Lake (13.7 μM)
> Conjola Lake (13.5 μM) > Durras Lake (11.6 μM) > Lake
Illawarra (11 μM) > Burrill Lake (9.37 μM) > Swan Lake
(9.31 μM). DIN:DSi values were mostly below the Redfield
(1958) ratio (DIN:DSi = 1:1) in the studied estuaries
(Fig. 14.3d, e). Overall, these values suggest a very low probability that Si was limiting phytoplankton growth in any of
the studied estuaries.
Fig. 14.2 Spatial variations of physical parameters in the studied estuaries during the sampling period
D. Liu et al.
rill Lake, Durras Lake, and Coila Lake) displayed a range of
turbidities between 2 and 4 NTU.
14.3.2 Spatial Variation of Chemical
Environmental Factors in the Studied
Estuaries
During the sampling period, the patterns and concentrations
of nutrients displayed distinct differences in both spatial and
temporal scales (Fig. 14.3).
Specific characteristics were observed in Lake Illawarra,
Coila Lake, and Swan Lake. Lake Illawarra displayed the
highest DIP concentrations but moderate levels of DIN compared to the other lakes (Fig. 14.3a, b); it was thus characterized by a significant N-limitation (Fig. 14.3d). In contrast,
Coila Lake was characterized by very low DIP concentrations but the highest DIN concentrations (Fig. 14.3a, b), indicating possible P-limitation (Fig. 14.3d). Swan Lake displayed the lowest DIN and DIP concentrations of all of the
studied lakes. For other lakes, most of the DIN concentrations were no more than 2 μM and DIP concentrations were
usually lower than 0.1 μM (Fig. 14.3a, b) and an alternation
of N-limiting and P-limiting conditions occurred in these estuaries during the sampling period (Fig. 14.3d).
DSi concentrations were high in all of the studied estuaries (Fig. 14.3c). These high values for DSi probably reflect the fact that all the catchments of the studied lakes are
dominated by quartz sandstones (Branagan and Packham
2000). The mean concentrations of DSi showed a gradient
from St. Georges Basin (14.5 μM) > Coila Lake (13.7 μM)
> Conjola Lake (13.5 μM) > Durras Lake (11.6 μM) > Lake
Illawarra (11 μM) > Burrill Lake (9.37 μM) > Swan Lake
(9.31 μM). DIN:DSi values were mostly below the Redfield
(1958) ratio (DIN:DSi = 1:1) in the studied estuaries
(Fig. 14.3d, e). Overall, these values suggest a very low probability that Si was limiting phytoplankton growth in any of
the studied estuaries.
Fig. 14.2 Spatial variations of physical parameters in the studied estuaries during the sampling period