

134
I. Caçador and B. Duarte
11.5 Eutrophication Versus
Phytoremediation
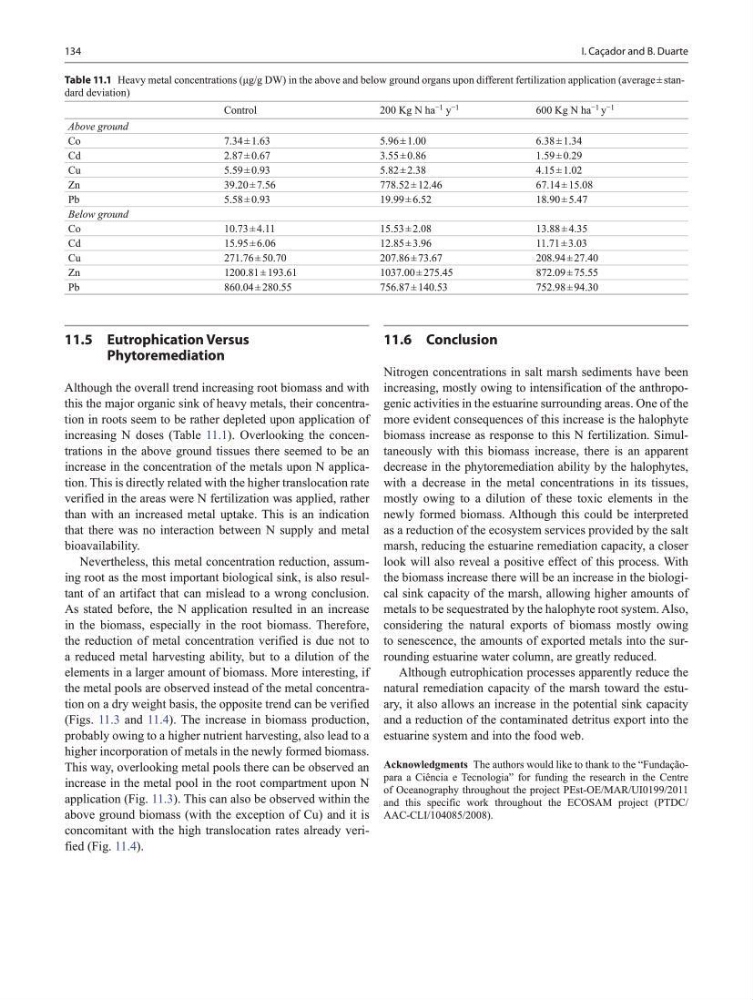
Although the overall trend increasing root biomass and with
this the major organic sink of heavy metals, their concentration in roots seem to be rather depleted upon application of
increasing N doses (Table 11.1). Overlooking the concentrations in the above ground tissues there seemed to be an
increase in the concentration of the metals upon N application. This is directly related with the higher translocation rate
verified in the areas were N fertilization was applied, rather
than with an increased metal uptake. This is an indication
that there was no interaction between N supply and metal
bioavailability.
Nevertheless, this metal concentration reduction, assuming root as the most important biological sink, is also resultant of an artifact that can mislead to a wrong conclusion.
As stated before, the N application resulted in an increase
in the biomass, especially in the root biomass. Therefore,
the reduction of metal concentration verified is due not to
a reduced metal harvesting ability, but to a dilution of the
elements in a larger amount of biomass. More interesting, if
the metal pools are observed instead of the metal concentration on a dry weight basis, the opposite trend can be verified
(Figs. 11.3 and 11.4). The increase in biomass production,
probably owing to a higher nutrient harvesting, also lead to a
higher incorporation of metals in the newly formed biomass.
This way, overlooking metal pools there can be observed an
increase in the metal pool in the root compartment upon N
application (Fig. 11.3). This can also be observed within the
above ground biomass (with the exception of Cu) and it is
concomitant with the high translocation rates already verified (Fig. 11.4).
11.6 Conclusion
Nitrogen concentrations in salt marsh sediments have been
increasing, mostly owing to intensification of the anthropogenic activities in the estuarine surrounding areas. One of the
more evident consequences of this increase is the halophyte
biomass increase as response to this N fertilization. Simultaneously with this biomass increase, there is an apparent
decrease in the phytoremediation ability by the halophytes,
with a decrease in the metal concentrations in its tissues,
mostly owing to a dilution of these toxic elements in the
newly formed biomass. Although this could be interpreted
as a reduction of the ecosystem services provided by the salt
marsh, reducing the estuarine remediation capacity, a closer
look will also reveal a positive effect of this process. With
the biomass increase there will be an increase in the biological sink capacity of the marsh, allowing higher amounts of
metals to be sequestrated by the halophyte root system. Also,
considering the natural exports of biomass mostly owing
to senescence, the amounts of exported metals into the surrounding estuarine water column, are greatly reduced.
Although eutrophication processes apparently reduce the
natural remediation capacity of the marsh toward the estuary, it also allows an increase in the potential sink capacity
and a reduction of the contaminated detritus export into the
estuarine system and into the food web.
Acknowledgments The authors would like to thank to the “Fundaçãopara a Ciência e Tecnologia” for funding the research in the Centre
of Oceanography throughout the project PEst-OE/MAR/UI0199/2011
and this specific work throughout the ECOSAM project (PTDC/
AAC-CLI/104085/2008).
Table 11.1 Heavy metal concentrations (μg/g DW) in the above and below ground organs upon different fertilization application (average ± standard deviation)
Control
200 Kg N ha −1 y −1
600 Kg N ha −1 y −1
Above ground
Co
7.34 ± 1.63
5.96 ± 1.00
6.38 ± 1.34
Cd
2.87 ± 0.67
3.55 ± 0.86
1.59 ± 0.29
Cu
5.59 ± 0.93
5.82 ± 2.38
4.15 ± 1.02
Zn
39.20 ± 7.56
778.52 ± 12.46
67.14 ± 15.08
Pb
5.58 ± 0.93
19.99 ± 6.52
18.90 ± 5.47
Below ground
Co
10.73 ± 4.11
15.53 ± 2.08
13.88 ± 4.35
Cd
15.95 ± 6.06
12.85 ± 3.96
11.71 ± 3.03
Cu
271.76 ± 50.70
207.86 ± 73.67
208.94 ± 27.40
Zn
1200.81 ± 193.61
1037.00 ± 275.45
872.09 ± 75.55
Pb
860.04 ± 280.55
756.87 ± 140.53
752.98 ± 94.30
I. Caçador and B. Duarte
11.5 Eutrophication Versus
Phytoremediation
Although the overall trend increasing root biomass and with
this the major organic sink of heavy metals, their concentration in roots seem to be rather depleted upon application of
increasing N doses (Table 11.1). Overlooking the concentrations in the above ground tissues there seemed to be an
increase in the concentration of the metals upon N application. This is directly related with the higher translocation rate
verified in the areas were N fertilization was applied, rather
than with an increased metal uptake. This is an indication
that there was no interaction between N supply and metal
bioavailability.
Nevertheless, this metal concentration reduction, assuming root as the most important biological sink, is also resultant of an artifact that can mislead to a wrong conclusion.
As stated before, the N application resulted in an increase
in the biomass, especially in the root biomass. Therefore,
the reduction of metal concentration verified is due not to
a reduced metal harvesting ability, but to a dilution of the
elements in a larger amount of biomass. More interesting, if
the metal pools are observed instead of the metal concentration on a dry weight basis, the opposite trend can be verified
(Figs. 11.3 and 11.4). The increase in biomass production,
probably owing to a higher nutrient harvesting, also lead to a
higher incorporation of metals in the newly formed biomass.
This way, overlooking metal pools there can be observed an
increase in the metal pool in the root compartment upon N
application (Fig. 11.3). This can also be observed within the
above ground biomass (with the exception of Cu) and it is
concomitant with the high translocation rates already verified (Fig. 11.4).
11.6 Conclusion
Nitrogen concentrations in salt marsh sediments have been
increasing, mostly owing to intensification of the anthropogenic activities in the estuarine surrounding areas. One of the
more evident consequences of this increase is the halophyte
biomass increase as response to this N fertilization. Simultaneously with this biomass increase, there is an apparent
decrease in the phytoremediation ability by the halophytes,
with a decrease in the metal concentrations in its tissues,
mostly owing to a dilution of these toxic elements in the
newly formed biomass. Although this could be interpreted
as a reduction of the ecosystem services provided by the salt
marsh, reducing the estuarine remediation capacity, a closer
look will also reveal a positive effect of this process. With
the biomass increase there will be an increase in the biological sink capacity of the marsh, allowing higher amounts of
metals to be sequestrated by the halophyte root system. Also,
considering the natural exports of biomass mostly owing
to senescence, the amounts of exported metals into the surrounding estuarine water column, are greatly reduced.
Although eutrophication processes apparently reduce the
natural remediation capacity of the marsh toward the estuary, it also allows an increase in the potential sink capacity
and a reduction of the contaminated detritus export into the
estuarine system and into the food web.
Acknowledgments The authors would like to thank to the “Fundaçãopara a Ciência e Tecnologia” for funding the research in the Centre
of Oceanography throughout the project PEst-OE/MAR/UI0199/2011
and this specific work throughout the ECOSAM project (PTDC/
AAC-CLI/104085/2008).
Table 11.1 Heavy metal concentrations (μg/g DW) in the above and below ground organs upon different fertilization application (average ± standard deviation)
Control
200 Kg N ha −1 y −1
600 Kg N ha −1 y −1
Above ground
Co
7.34 ± 1.63
5.96 ± 1.00
6.38 ± 1.34
Cd
2.87 ± 0.67
3.55 ± 0.86
1.59 ± 0.29
Cu
5.59 ± 0.93
5.82 ± 2.38
4.15 ± 1.02
Zn
39.20 ± 7.56
778.52 ± 12.46
67.14 ± 15.08
Pb
5.58 ± 0.93
19.99 ± 6.52
18.90 ± 5.47
Below ground
Co
10.73 ± 4.11
15.53 ± 2.08
13.88 ± 4.35
Cd
15.95 ± 6.06
12.85 ± 3.96
11.71 ± 3.03
Cu
271.76 ± 50.70
207.86 ± 73.67
208.94 ± 27.40
Zn
1200.81 ± 193.61
1037.00 ± 275.45
872.09 ± 75.55
Pb
860.04 ± 280.55
756.87 ± 140.53
752.98 ± 94.30