

A. Pavlidou et al.
128
10.4 Conclusions
Significant changes in nutrient dynamics were observed
after the operation of the primary sewage treatment plant
with higher nutrient concentrations recorded in the inner Saronikos Gulf. It seems that the high amount of the primarily
treated effluents that discharged in the inner Saronikos Gulf
led to the significant increase of nutrient concentrations in
the water column nearby to the sewage outfall. After 2005,
when the secondary sewage treatment operated, a general
decrease in nutrient concentrations in the inner Saronikos
Gulf was observed.
A shift from Si-limitation to N-limitation was observed
at station S7, based on 25 years of data, suggesting changes
Table 10.6 Results of one way anova performed in order to compare the nutrient concentrations among the three periods of measurements, A:
1987–1994, B: 1995–2004, C: 2005–2010. The P values in italics indicate significant mean difference at the 0.05 level
Parameter
PO 4
NO 3
NH 4
N:P
S7
Periods
A-B
A-C
B-C
A-B
A-C
B-C
A-B
A-C
B-C
A-B
A-C
B-C
P values
0.020
0.660
0.000
0.050
0.966
0.020
0.070
0.646
0.515
0.121
0.739
0.013
S11
Periods
A-B
A-C
B-C
A-B
A-C
B-C
A-B
A-C
B-C
A-B
A-C
B-C
P values
0.000
0.886
0.000
0.000
0.951
0.000
1.000
0.343
0.224
0.986
0.945
0.978
S13
Periods
A-B
A-C
B-C
A-B
A-C
B-C
A-B
A-C
B-C
A-B
A-C
B-C
P values
0.000
0.932
0.000
0.000
0.952
0.009
0.673
0.994
0.609
0.759
0.625
0.101
S16
Periods
A-B
A-C
B-C
A-B
A-C
B-C
A-B
A-C
B-C
A-B
A-C
B-C
P values
0.368
0.188
0.030
0.046
0.922
0.014
0.731
0.316
0.634
0.703
0.257
0.802
S8
Periods
A-B
A-C
B-C
A-B
A-C
B-C
A-B
A-C
B-C
A-B
A-C
B-C
P values
0.000
0.421
0.158
0.012
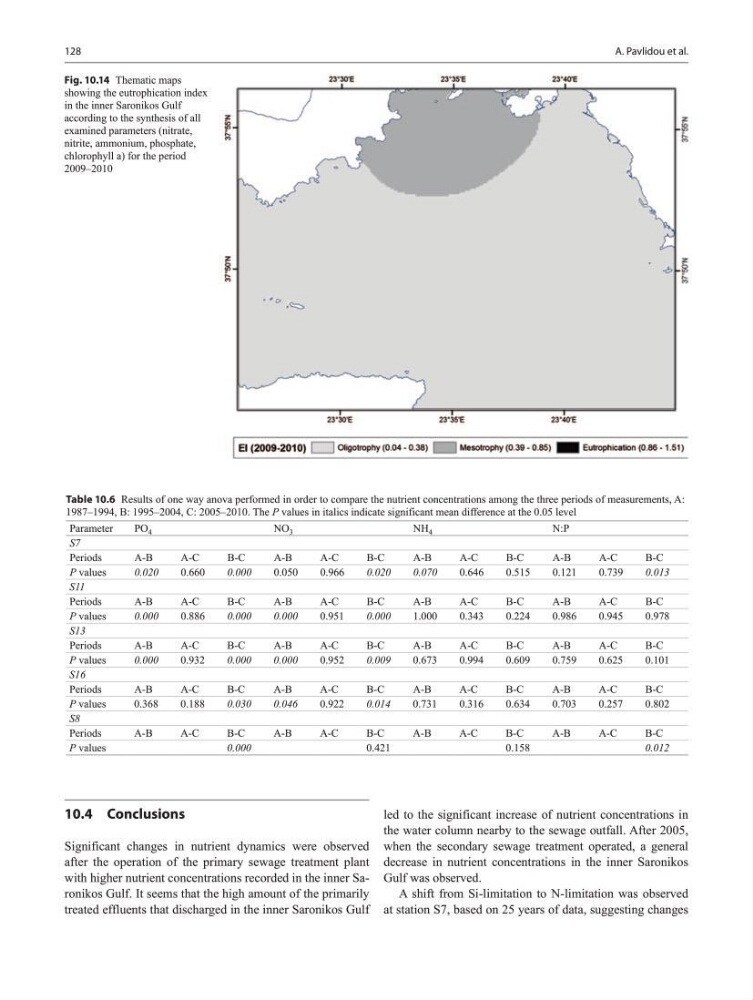
Fig. 10.14 Thematic maps
showing the eutrophication index
in the inner Saronikos Gulf
according to the synthesis of all
examined parameters (nitrate,
nitrite, ammonium, phosphate,
chlorophyll a) for the period
2009–2010
128
10.4 Conclusions
Significant changes in nutrient dynamics were observed
after the operation of the primary sewage treatment plant
with higher nutrient concentrations recorded in the inner Saronikos Gulf. It seems that the high amount of the primarily
treated effluents that discharged in the inner Saronikos Gulf
led to the significant increase of nutrient concentrations in
the water column nearby to the sewage outfall. After 2005,
when the secondary sewage treatment operated, a general
decrease in nutrient concentrations in the inner Saronikos
Gulf was observed.
A shift from Si-limitation to N-limitation was observed
at station S7, based on 25 years of data, suggesting changes
Table 10.6 Results of one way anova performed in order to compare the nutrient concentrations among the three periods of measurements, A:
1987–1994, B: 1995–2004, C: 2005–2010. The P values in italics indicate significant mean difference at the 0.05 level
Parameter
PO 4
NO 3
NH 4
N:P
S7
Periods
A-B
A-C
B-C
A-B
A-C
B-C
A-B
A-C
B-C
A-B
A-C
B-C
P values
0.020
0.660
0.000
0.050
0.966
0.020
0.070
0.646
0.515
0.121
0.739
0.013
S11
Periods
A-B
A-C
B-C
A-B
A-C
B-C
A-B
A-C
B-C
A-B
A-C
B-C
P values
0.000
0.886
0.000
0.000
0.951
0.000
1.000
0.343
0.224
0.986
0.945
0.978
S13
Periods
A-B
A-C
B-C
A-B
A-C
B-C
A-B
A-C
B-C
A-B
A-C
B-C
P values
0.000
0.932
0.000
0.000
0.952
0.009
0.673
0.994
0.609
0.759
0.625
0.101
S16
Periods
A-B
A-C
B-C
A-B
A-C
B-C
A-B
A-C
B-C
A-B
A-C
B-C
P values
0.368
0.188
0.030
0.046
0.922
0.014
0.731
0.316
0.634
0.703
0.257
0.802
S8
Periods
A-B
A-C
B-C
A-B
A-C
B-C
A-B
A-C
B-C
A-B
A-C
B-C
P values
0.000
0.421
0.158
0.012
Fig. 10.14 Thematic maps
showing the eutrophication index
in the inner Saronikos Gulf
according to the synthesis of all
examined parameters (nitrate,
nitrite, ammonium, phosphate,
chlorophyll a) for the period
2009–2010