

107
9 Photoautotrophic Productivity in Eutrophic Ecosystems
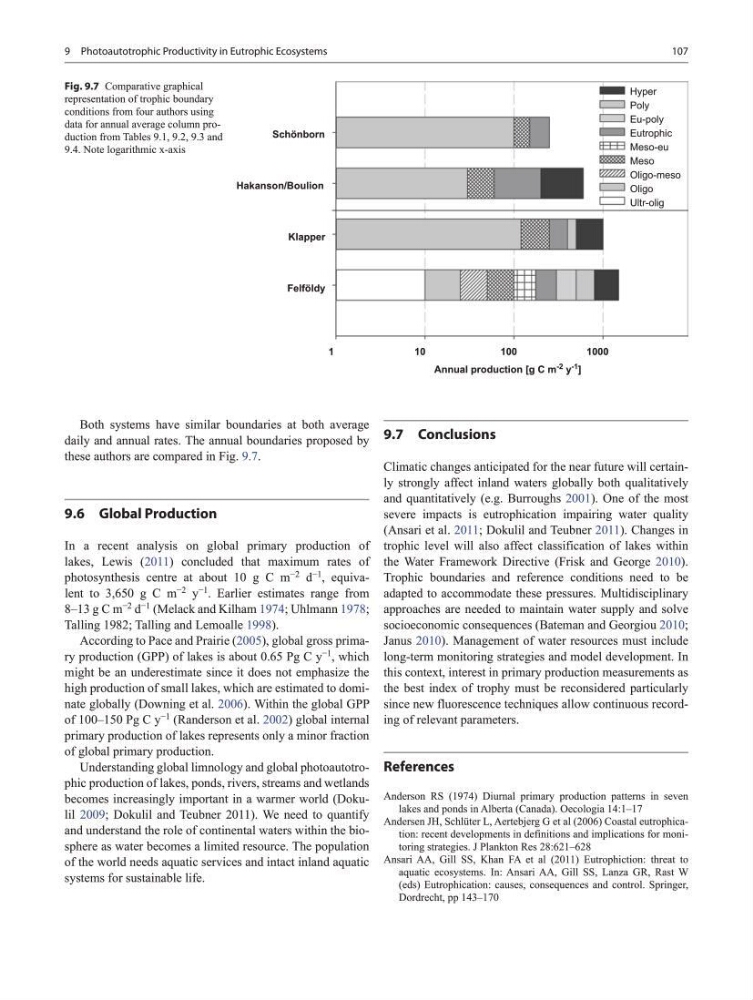
Both systems have similar boundaries at both average
daily and annual rates. The annual boundaries proposed by
these authors are compared in Fig. 9.7.
9.6 Global Production
In a recent analysis on global primary production of
lakes, Lewis (2011) concluded that maximum rates of
photosynthesis centre at about 10 g C m
−2
d
−1
, equivalent to 3,650 g C m
−2
y
−1
. Earlier estimates range from
8–13 g C m
−2
d
−1
(Melack and Kilham 1974; Uhlmann 1978;
Talling 1982; Talling and Lemoalle 1998).
According to Pace and Prairie (2005), global gross primary production (GPP) of lakes is about 0.65 Pg C y
−1
, which
might be an underestimate since it does not emphasize the
high production of small lakes, which are estimated to dominate globally (Downing et al. 2006). Within the global GPP
of 100–150 Pg C y
−1
(Randerson et al. 2002) global internal
primary production of lakes represents only a minor fraction
of global primary production.
Understanding global limnology and global photoautotrophic production of lakes, ponds, rivers, streams and wetlands
becomes increasingly important in a warmer world (Dokulil 2009; Dokulil and Teubner 2011). We need to quantify
and understand the role of continental waters within the biosphere as water becomes a limited resource. The population
of the world needs aquatic services and intact inland aquatic
systems for sustainable life.
9.7 Conclusions
Climatic changes anticipated for the near future will certainly strongly affect inland waters globally both qualitatively
and quantitatively (e.g. Burroughs 2001). One of the most
severe impacts is eutrophication impairing water quality
(Ansari et al. 2011; Dokulil and Teubner 2011). Changes in
trophic level will also affect classification of lakes within
the Water Framework Directive (Frisk and George 2010).
Trophic boundaries and reference conditions need to be
adapted to accommodate these pressures. Multidisciplinary
approaches are needed to maintain water supply and solve
socioeconomic consequences (Bateman and Georgiou 2010;
Janus 2010). Management of water resources must include
long-term monitoring strategies and model development. In
this context, interest in primary production measurements as
the best index of trophy must be reconsidered particularly
since new fluorescence techniques allow continuous recording of relevant parameters.
References
Anderson RS (1974) Diurnal primary production patterns in seven
lakes and ponds in Alberta (Canada). Oecologia 14:1–17
Andersen JH, Schlüter L, Aertebjerg G et al (2006) Coastal eutrophication: recent developments in definitions and implications for monitoring strategies. J Plankton Res 28:621–628
Ansari AA, Gill SS, Khan FA et al (2011) Eutrophiction: threat to
aquatic ecosystems. In: Ansari AA, Gill SS, Lanza GR, Rast W
(eds) Eutrophication: causes, consequences and control. Springer,
Dordrecht, pp 143–170
Annual production [g C m -2 y -1 ]
1
1 0
100
1000
Felföldy
Klapper
Hakanson/Boulion
Schönborn
Hyper
Poly
Eu-poly
Eutrophic
Meso-eu
Meso
Oligo-meso
Oligo
Ultr-olig
Fig. 9.7 Comparative graphical
representation of trophic boundary
conditions from four authors using
data for annual average column production from Tables 9.1, 9.2, 9.3 and
9.4. Note logarithmic x-axis
9 Photoautotrophic Productivity in Eutrophic Ecosystems
Both systems have similar boundaries at both average
daily and annual rates. The annual boundaries proposed by
these authors are compared in Fig. 9.7.
9.6 Global Production
In a recent analysis on global primary production of
lakes, Lewis (2011) concluded that maximum rates of
photosynthesis centre at about 10 g C m
−2
d
−1
, equivalent to 3,650 g C m
−2
y
−1
. Earlier estimates range from
8–13 g C m
−2
d
−1
(Melack and Kilham 1974; Uhlmann 1978;
Talling 1982; Talling and Lemoalle 1998).
According to Pace and Prairie (2005), global gross primary production (GPP) of lakes is about 0.65 Pg C y
−1
, which
might be an underestimate since it does not emphasize the
high production of small lakes, which are estimated to dominate globally (Downing et al. 2006). Within the global GPP
of 100–150 Pg C y
−1
(Randerson et al. 2002) global internal
primary production of lakes represents only a minor fraction
of global primary production.
Understanding global limnology and global photoautotrophic production of lakes, ponds, rivers, streams and wetlands
becomes increasingly important in a warmer world (Dokulil 2009; Dokulil and Teubner 2011). We need to quantify
and understand the role of continental waters within the biosphere as water becomes a limited resource. The population
of the world needs aquatic services and intact inland aquatic
systems for sustainable life.
9.7 Conclusions
Climatic changes anticipated for the near future will certainly strongly affect inland waters globally both qualitatively
and quantitatively (e.g. Burroughs 2001). One of the most
severe impacts is eutrophication impairing water quality
(Ansari et al. 2011; Dokulil and Teubner 2011). Changes in
trophic level will also affect classification of lakes within
the Water Framework Directive (Frisk and George 2010).
Trophic boundaries and reference conditions need to be
adapted to accommodate these pressures. Multidisciplinary
approaches are needed to maintain water supply and solve
socioeconomic consequences (Bateman and Georgiou 2010;
Janus 2010). Management of water resources must include
long-term monitoring strategies and model development. In
this context, interest in primary production measurements as
the best index of trophy must be reconsidered particularly
since new fluorescence techniques allow continuous recording of relevant parameters.
References
Anderson RS (1974) Diurnal primary production patterns in seven
lakes and ponds in Alberta (Canada). Oecologia 14:1–17
Andersen JH, Schlüter L, Aertebjerg G et al (2006) Coastal eutrophication: recent developments in definitions and implications for monitoring strategies. J Plankton Res 28:621–628
Ansari AA, Gill SS, Khan FA et al (2011) Eutrophiction: threat to
aquatic ecosystems. In: Ansari AA, Gill SS, Lanza GR, Rast W
(eds) Eutrophication: causes, consequences and control. Springer,
Dordrecht, pp 143–170
Annual production [g C m -2 y -1 ]
1
1 0
100
1000
Felföldy
Klapper
Hakanson/Boulion
Schönborn
Hyper
Poly
Eu-poly
Eutrophic
Meso-eu
Meso
Oligo-meso
Oligo
Ultr-olig
Fig. 9.7 Comparative graphical
representation of trophic boundary
conditions from four authors using
data for annual average column production from Tables 9.1, 9.2, 9.3 and
9.4. Note logarithmic x-axis