

87
et al., 1988; Gieskes et aI, 1991; Fig. 14). Even the concentration of phaeopigments (of
which there are many, e.g., Gieskes and Kraay, 1986a) cannot always be used as a measure
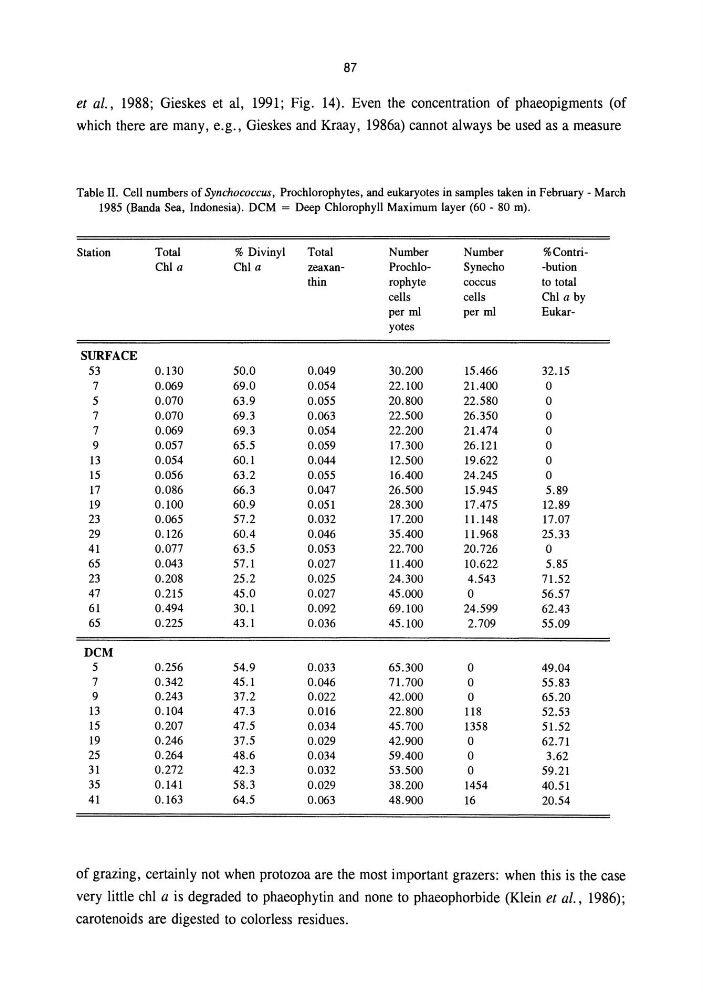
Table II. Cell numbers of Synchococcus, Prochlorophytes, and eukaryotes in samples taken in February - March
1985 (Banda Sea, Indonesia). DCM = Deep Chlorophyll Maximum layer (60 - 80 m).
Station
Total
% Divinyl
Total
Number
Number
%ContriChi a
Chi a
ProchloSynecho
-bution
thin
rophyte
coccus
to total
cells
cells
Chi a by
per ml
per ml
Eukaryotes
SURFACE
53
0.130
50.0
0.049
30.200
15.466
32.15
7
0.069
69.0
0.054
22.100
21.400
0
5
0.070
63.9
0.055
20.800
22.580
0
7
0.070
69.3
0.063
22.500
26.350
0
7
0.069
69.3
0.054
22.200
21.474
0
9
0.057
65.5
0.059
17.300
26.121
0
13
0.054
60.1
0.044
12.500
19.622
0
15
0.056
63.2
0.055
16.400
24.245
0
17
0.086
66.3
0.047
26.500
15.945
5.89
19
0.100
60.9
0.051
28.300
17 .475
12.89
23
0.065
57.2
0.032
17.200
11.148
17.07
29
0.126
60.4
0.046
35.400
11.968
25.33
41
0.077
63.5
0.053
22.700
20.726
0
65
0.043
57.1
0.027
11.400
10.622
5.85
23
0.208
25.2
0.025
24.300
4.543
71.52
47
0.215
45.0
0.027
45.000
0
56.57
61
0.494
30.1
0.092
69.100
24.599
62.43
65
0.225
43.1
0.036
45.100
2.709
55.09
DCM
5
0.256
54.9
0.033
65.300
0
49.04
7
0.342
45.1
0.046
71.700
0
55.83
9
0.243
37.2
0.022
42.000
0
65.20
13
0.104
47.3
0.016
22.800
118
52.53
15
0.207
47.5
0.034
45.700
1358
51.52
19
0.246
37.5
0.029
42.900
0
62.71
25
0.264
48.6
0.034
59.400
0
3.62
31
0.272
42.3
0.032
53.500
0
59.21
35
0.141
58.3
0.029
38.200
1454
40.51
41
0.163
64.5
0.063
48.900
16
20.54
of grazing, certainly not when protozoa are the most important grazers: when this is the case
very little chI a is degraded to phaeophytin and none to phaeophorbide (Klein et al., 1986);
carotenoids are digested to colorless residues.
et al., 1988; Gieskes et aI, 1991; Fig. 14). Even the concentration of phaeopigments (of
which there are many, e.g., Gieskes and Kraay, 1986a) cannot always be used as a measure
Table II. Cell numbers of Synchococcus, Prochlorophytes, and eukaryotes in samples taken in February - March
1985 (Banda Sea, Indonesia). DCM = Deep Chlorophyll Maximum layer (60 - 80 m).
Station
Total
% Divinyl
Total
Number
Number
%ContriChi a
Chi a
ProchloSynecho
-bution
thin
rophyte
coccus
to total
cells
cells
Chi a by
per ml
per ml
Eukaryotes
SURFACE
53
0.130
50.0
0.049
30.200
15.466
32.15
7
0.069
69.0
0.054
22.100
21.400
0
5
0.070
63.9
0.055
20.800
22.580
0
7
0.070
69.3
0.063
22.500
26.350
0
7
0.069
69.3
0.054
22.200
21.474
0
9
0.057
65.5
0.059
17.300
26.121
0
13
0.054
60.1
0.044
12.500
19.622
0
15
0.056
63.2
0.055
16.400
24.245
0
17
0.086
66.3
0.047
26.500
15.945
5.89
19
0.100
60.9
0.051
28.300
17 .475
12.89
23
0.065
57.2
0.032
17.200
11.148
17.07
29
0.126
60.4
0.046
35.400
11.968
25.33
41
0.077
63.5
0.053
22.700
20.726
0
65
0.043
57.1
0.027
11.400
10.622
5.85
23
0.208
25.2
0.025
24.300
4.543
71.52
47
0.215
45.0
0.027
45.000
0
56.57
61
0.494
30.1
0.092
69.100
24.599
62.43
65
0.225
43.1
0.036
45.100
2.709
55.09
DCM
5
0.256
54.9
0.033
65.300
0
49.04
7
0.342
45.1
0.046
71.700
0
55.83
9
0.243
37.2
0.022
42.000
0
65.20
13
0.104
47.3
0.016
22.800
118
52.53
15
0.207
47.5
0.034
45.700
1358
51.52
19
0.246
37.5
0.029
42.900
0
62.71
25
0.264
48.6
0.034
59.400
0
3.62
31
0.272
42.3
0.032
53.500
0
59.21
35
0.141
58.3
0.029
38.200
1454
40.51
41
0.163
64.5
0.063
48.900
16
20.54
of grazing, certainly not when protozoa are the most important grazers: when this is the case
very little chI a is degraded to phaeophytin and none to phaeophorbide (Klein et al., 1986);
carotenoids are digested to colorless residues.