

74
1.0
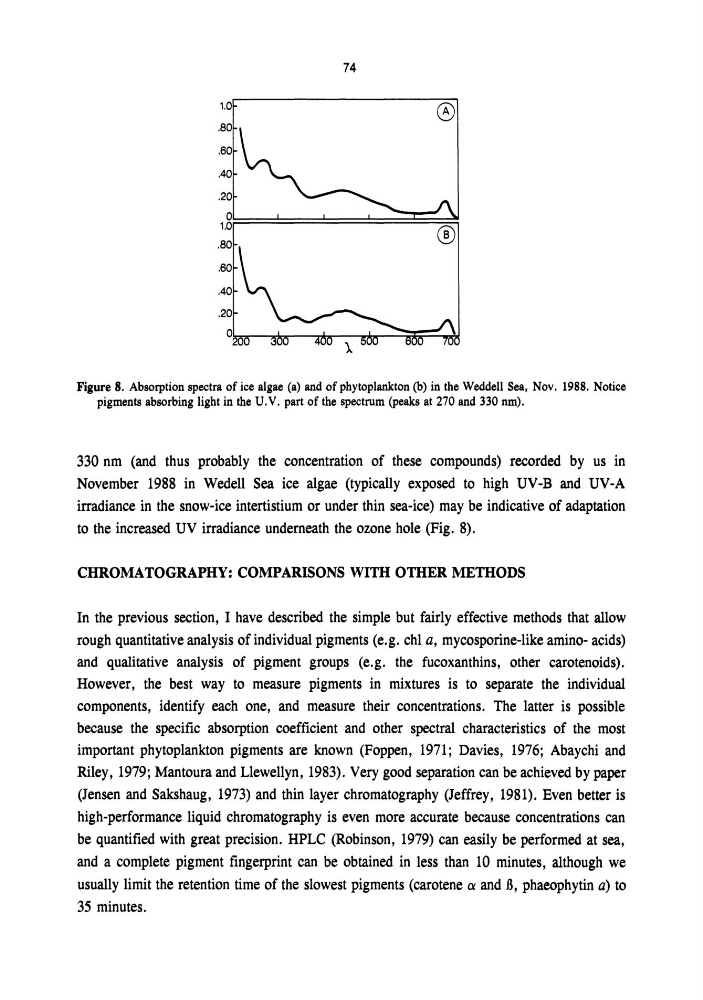
Figure 8. Absorption spectra of ice algae (a) and of phytoplankton (b) in the Weddell Sea, Nov. 1988. Notice
pigments absorbing light in the U.V. part of the spectrum (peaks at 270 and 330 nm).
330 nm (and thus probably the concentration of these compounds) recorded by us in
November 1988 in Wedell Sea ice algae (typically exposed to high UV-B and UV-A
irradiance in the snow-ice intertistium or under thin sea-ice) may be indicative of adaptation
to the increased UV irradiance underneath the ozone hole (Fig. 8).
CHROMATOGRAPHY: COMPARISONS WITH OTHER METHODS
In the previous section, I have described the simple but fairly effective methods that allow
rough quantitative analysis of individual pigments (e.g. chI a, mycosporine-like amino- acids)
and qualitative analysis of pigment groups (e.g. the fucoxanthins, other carotenoids).
However, the best way to measure pigments in mixtures is to separate the individual
components, identify each one, and measure their concentrations. The latter is possible
because the specific absorption coefficient and other spectral characteristics of the most
important phytoplankton pigments are known (Foppen, 1971; Davies, 1976; Abaychi and
Riley, 1979; Mantoura and Llewellyn, 1983). Very good separation can be achieved by paper
(Jensen and Sakshaug, 1973) and thin layer chromatography (Jeffrey, 1981). Even better is
high-performance liquid chromatography is even more accurate because concentrations can
be quantified with great precision. HPLC (Robinson, 1979) can easily be performed at sea,
and a complete pigment fingerprint can be obtained in less than 10 minutes, although we
usually limit the retention time of the slowest pigments (carotene ex and fi, phaeophytin a) to
35 minutes.
1.0
Figure 8. Absorption spectra of ice algae (a) and of phytoplankton (b) in the Weddell Sea, Nov. 1988. Notice
pigments absorbing light in the U.V. part of the spectrum (peaks at 270 and 330 nm).
330 nm (and thus probably the concentration of these compounds) recorded by us in
November 1988 in Wedell Sea ice algae (typically exposed to high UV-B and UV-A
irradiance in the snow-ice intertistium or under thin sea-ice) may be indicative of adaptation
to the increased UV irradiance underneath the ozone hole (Fig. 8).
CHROMATOGRAPHY: COMPARISONS WITH OTHER METHODS
In the previous section, I have described the simple but fairly effective methods that allow
rough quantitative analysis of individual pigments (e.g. chI a, mycosporine-like amino- acids)
and qualitative analysis of pigment groups (e.g. the fucoxanthins, other carotenoids).
However, the best way to measure pigments in mixtures is to separate the individual
components, identify each one, and measure their concentrations. The latter is possible
because the specific absorption coefficient and other spectral characteristics of the most
important phytoplankton pigments are known (Foppen, 1971; Davies, 1976; Abaychi and
Riley, 1979; Mantoura and Llewellyn, 1983). Very good separation can be achieved by paper
(Jensen and Sakshaug, 1973) and thin layer chromatography (Jeffrey, 1981). Even better is
high-performance liquid chromatography is even more accurate because concentrations can
be quantified with great precision. HPLC (Robinson, 1979) can easily be performed at sea,
and a complete pigment fingerprint can be obtained in less than 10 minutes, although we
usually limit the retention time of the slowest pigments (carotene ex and fi, phaeophytin a) to
35 minutes.