

,
A
,
\
\
I \
\ I
\1
t
I
I
(,I'J
IV
400
450
73
I
I
I
I
r\
I
I \
I
'"'~\ I
V
500
550
600
650
wavelength (n rn)
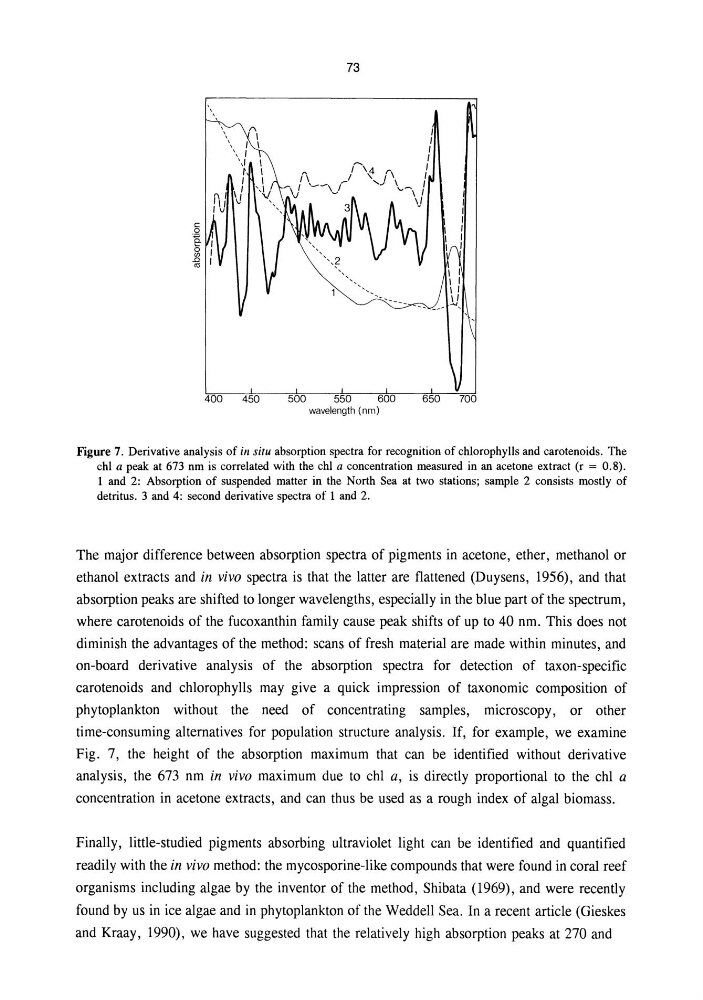
Figure 7. Derivative analysis of ill situ absorption spectra for recognition of chlorophylls and carotenoids. The
chi a peak at 673 nm is correlated with the chi a concentration measured in an acetone extract (r = 0.8).
1 and 2: Absorption of suspended matter in the North Sea at two stations; sample 2 consists mostly of
detritus. 3 and 4: second derivative spectra of 1 and 2.
The major difference between absorption spectra of pigments in acetone, ether, methanol or
ethanol extracts and in vivo spectra is that the latter are flattened (Duysens, 1956), and that
absorption peaks are shifted to longer wavelengths, especially in the blue part of the spectrum,
where carotenoids of the fucoxanthin family cause peak shifts of up to 40 nm. This does not
diminish the advantages of the method: scans of fresh material are made within minutes, and
on-board derivative analysis of the absorption spectra for detection of taxon-specific
carotenoids and chlorophylls may give a quick impression of taxonomic composition of
phytoplankton without the need of concentrating samples, microscopy, or other
time-consuming alternatives for population structure analysis. If, for example, we examine
Fig. 7, the height of the absorption maximum that can be identified without derivative
analysis, the 673 nm in vivo maximum due to chI a, is directly proportional to the chI a
concentration in acetone extracts, and can thus be used as a rough index of algal biomass.
Finally, little-studied pigments absorbing ultraviolet light can be identified and quantified
readily with the in vivo method: the mycosporine-like compounds that were found in coral reef
organisms including algae by the inventor of the method, Shibata (1969), and were recently
found by us in ice algae and in phytoplankton of the Weddell Sea. In a recent article (Gieskes
and Kraay, 1990), we have suggested that the relatively high absorption peaks at 270 and
A
,
\
\
I \
\ I
\1
t
I
I
(,I'J
IV
400
450
73
I
I
I
I
r\
I
I \
I
'"'~\ I
V
500
550
600
650
wavelength (n rn)
Figure 7. Derivative analysis of ill situ absorption spectra for recognition of chlorophylls and carotenoids. The
chi a peak at 673 nm is correlated with the chi a concentration measured in an acetone extract (r = 0.8).
1 and 2: Absorption of suspended matter in the North Sea at two stations; sample 2 consists mostly of
detritus. 3 and 4: second derivative spectra of 1 and 2.
The major difference between absorption spectra of pigments in acetone, ether, methanol or
ethanol extracts and in vivo spectra is that the latter are flattened (Duysens, 1956), and that
absorption peaks are shifted to longer wavelengths, especially in the blue part of the spectrum,
where carotenoids of the fucoxanthin family cause peak shifts of up to 40 nm. This does not
diminish the advantages of the method: scans of fresh material are made within minutes, and
on-board derivative analysis of the absorption spectra for detection of taxon-specific
carotenoids and chlorophylls may give a quick impression of taxonomic composition of
phytoplankton without the need of concentrating samples, microscopy, or other
time-consuming alternatives for population structure analysis. If, for example, we examine
Fig. 7, the height of the absorption maximum that can be identified without derivative
analysis, the 673 nm in vivo maximum due to chI a, is directly proportional to the chI a
concentration in acetone extracts, and can thus be used as a rough index of algal biomass.
Finally, little-studied pigments absorbing ultraviolet light can be identified and quantified
readily with the in vivo method: the mycosporine-like compounds that were found in coral reef
organisms including algae by the inventor of the method, Shibata (1969), and were recently
found by us in ice algae and in phytoplankton of the Weddell Sea. In a recent article (Gieskes
and Kraay, 1990), we have suggested that the relatively high absorption peaks at 270 and