

373
range of light intensities, and this trend was reflected in the flow cytometric measurements:
488-nm excited fluorescence/chlorophyll a increased more over this range than did that excited
by 436 nm.
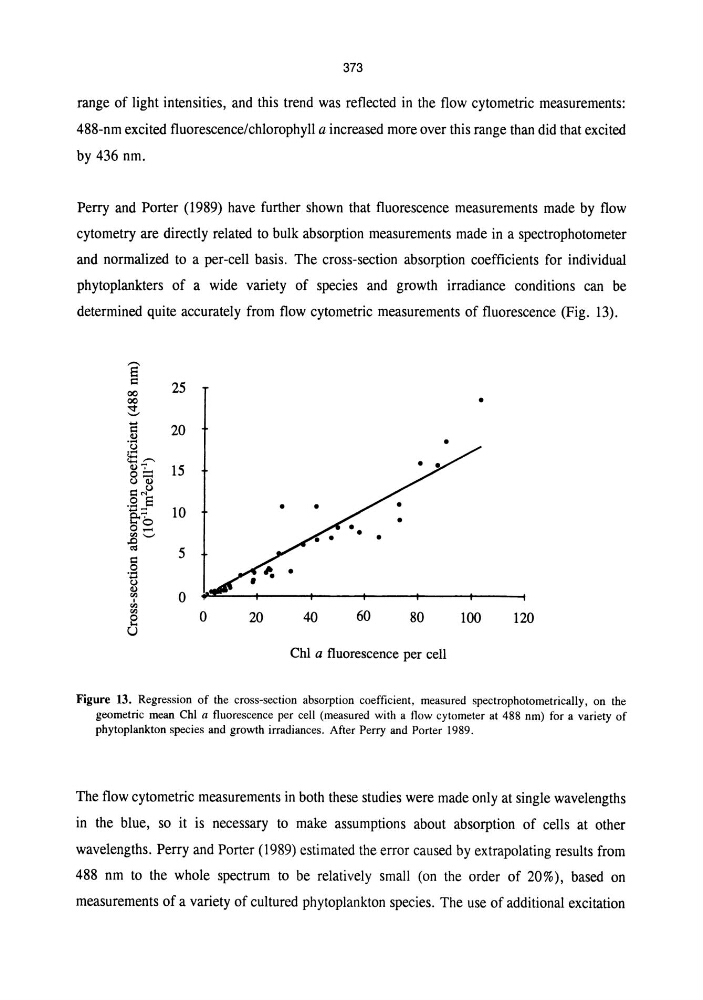
Perry and Porter (1989) have further shown that fluorescence measurements made by flow
cytometry are directly related to bulk absorption measurements made in a spectrophotometer
and normalized to a per-cell basis. The cross-section absorption coefficients for individual
phytoplankters of a wide variety of species and growth irradiance conditions can be
determined quite accurately from flow cytometric measurements of fluorescence (Fig. 13).
'"'
~
25
00
00
•
:::!:,
.....
20
s::
U
·5
•
5.-. U7 15
o:=: C) U
S:: .. ,eJ
.gjl 10
fr7
o~
'" '-'
,rJ
§
.l:l
C)
U
0
'"
I
'" '"
0
8
20
40
60
120
80
100
Chl a fluorescence per cell
Figure 13. Regression of the cross-section absorption coefficient, measured spectrophotometrically, on the
geometric mean Chi a fluorescence per cell (measured with a flow cytometer at 488 nm) for a variety of
phytoplankton species and growth irradiances. After Perry and Porter 1989.
The flow cytometric measurements in both these studies were made only at single wavelengths
in the blue, so it is necessary to make assumptions about absorption of cells at other
wavelengths. Perry and Porter (1989) estimated the error caused by extrapolating results from
488 nm to the whole spectrum to be relatively small (on the order of 20%), based on
measurements of a variety of cultured phytoplankton species. The use of additional excitation
range of light intensities, and this trend was reflected in the flow cytometric measurements:
488-nm excited fluorescence/chlorophyll a increased more over this range than did that excited
by 436 nm.
Perry and Porter (1989) have further shown that fluorescence measurements made by flow
cytometry are directly related to bulk absorption measurements made in a spectrophotometer
and normalized to a per-cell basis. The cross-section absorption coefficients for individual
phytoplankters of a wide variety of species and growth irradiance conditions can be
determined quite accurately from flow cytometric measurements of fluorescence (Fig. 13).
'"'
~
25
00
00
•
:::!:,
.....
20
s::
U
·5
•
5.-. U7 15
o:=: C) U
S:: .. ,eJ
.gjl 10
fr7
o~
'" '-'
,rJ
§
.l:l
C)
U
0
'"
I
'" '"
0
8
20
40
60
120
80
100
Chl a fluorescence per cell
Figure 13. Regression of the cross-section absorption coefficient, measured spectrophotometrically, on the
geometric mean Chi a fluorescence per cell (measured with a flow cytometer at 488 nm) for a variety of
phytoplankton species and growth irradiances. After Perry and Porter 1989.
The flow cytometric measurements in both these studies were made only at single wavelengths
in the blue, so it is necessary to make assumptions about absorption of cells at other
wavelengths. Perry and Porter (1989) estimated the error caused by extrapolating results from
488 nm to the whole spectrum to be relatively small (on the order of 20%), based on
measurements of a variety of cultured phytoplankton species. The use of additional excitation