

372
:::I 1.0
.,
A
0
....
g, 0.8
.,
0
c:: O.S
.,
~
~ 0.'
rE .,
/), A. carteri
> 0.2
T. weissflogii
'J:)
0
01
Ql
... H. carterae
~
12
"
Chi a (pg cell'l)
0.5
0.4
1:1
:2 0.3
U
<..> 0.2
:2
U
0.1
0.0
1:1 1.0
:2
C
u .. 0.8 ~
,A
1!.
c::
..
'2
Il
:e ·c 0.'
.,
Q.,
.....
....
~
0 0.4
~ c:: 0.2
01
><
0
0
&: 0.0
0
200
400
lIDO
lIDO
100II
Irradiance (!lmol quanta m'2s'l)
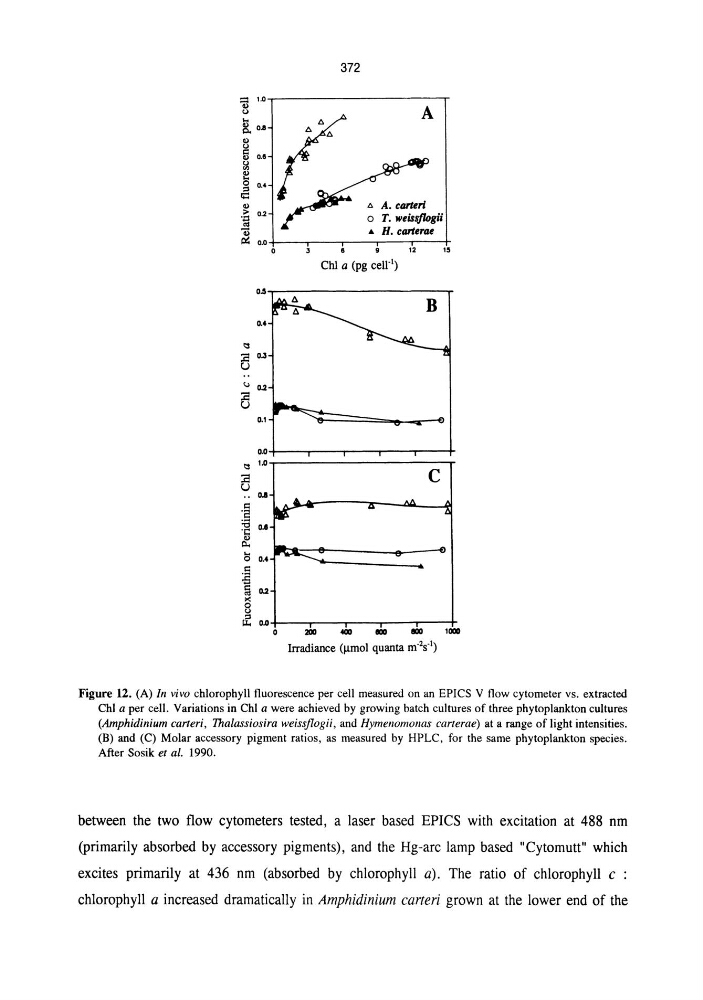
Figure 12. (A) In vivo chlorophyll fluorescence per cell measured on an EPICS V flow cytometer vs. extracted
ChI a per cell. Variations in ChI a were achieved by growing batch cultures of three phytoplankton cultures
(Amphidinium carteri, Thalassiosira weissflogii, and Hymenomonas carterae) at a range of light intensities.
(B) and (C) Molar accessory pigment ratios, as measured by HPLC, for the same phytoplankton species.
After Sosik et al. 1990.
between the two flow cytometers tested, a laser based EPICS with excitation at 488 nm
(primarily absorbed by accessory pigments), and the Hg-arc lamp based "Cytomutt" which
excites primarily at 436 nm (absorbed by chlorophyll a). The ratio of chlorophyll c :
chlorophyll a increased dramatically in Amphidinium carteri grown at the lower end of the
:::I 1.0
.,
A
0
....
g, 0.8
.,
0
c:: O.S
.,
~
~ 0.'
rE .,
/), A. carteri
> 0.2
T. weissflogii
'J:)
0
01
Ql
... H. carterae
~
12
"
Chi a (pg cell'l)
0.5
0.4
1:1
:2 0.3
U
<..> 0.2
:2
U
0.1
0.0
1:1 1.0
:2
C
u .. 0.8 ~
,A
1!.
c::
..
'2
Il
:e ·c 0.'
.,
Q.,
.....
....
~
0 0.4
~ c:: 0.2
01
><
0
0
&: 0.0
0
200
400
lIDO
lIDO
100II
Irradiance (!lmol quanta m'2s'l)
Figure 12. (A) In vivo chlorophyll fluorescence per cell measured on an EPICS V flow cytometer vs. extracted
ChI a per cell. Variations in ChI a were achieved by growing batch cultures of three phytoplankton cultures
(Amphidinium carteri, Thalassiosira weissflogii, and Hymenomonas carterae) at a range of light intensities.
(B) and (C) Molar accessory pigment ratios, as measured by HPLC, for the same phytoplankton species.
After Sosik et al. 1990.
between the two flow cytometers tested, a laser based EPICS with excitation at 488 nm
(primarily absorbed by accessory pigments), and the Hg-arc lamp based "Cytomutt" which
excites primarily at 436 nm (absorbed by chlorophyll a). The ratio of chlorophyll c :
chlorophyll a increased dramatically in Amphidinium carteri grown at the lower end of the