

357
(Ostrea edulis) preferentially removed dinoflagellate cells from a mixture of three species (a
diatom, a dinoflagellate, and a phycoerythrin-containing cryptophyte) (Fig. 4). Several other
studies have shown grazing preferences by a variety of filter feeders (Cucci et al. 1985;
Stoecker et aT. 1986; Shumway and Cucci 1987; Burkill et af. 1990).
Flow cytometry has been utilized in these kinds of grazing studies in the field as well. Newell
et aT. (1989) observed a reduction in the number of red-fluorescing particles along a transect
across a mussel bed (relative to particles without red fluorescence), which could be interpreted
as selective removal of chlorophyll-containing phytoplankton by the mussels. Field studies
c
o
.~
~
§
U
60
50
B
40
-Control
--Grazed
30
10
-. ..
0t-~~--~--~--~--~--T-o
20
40
60
110
100
120
Chlorophyll a Fluorescence per cell
(relative units)
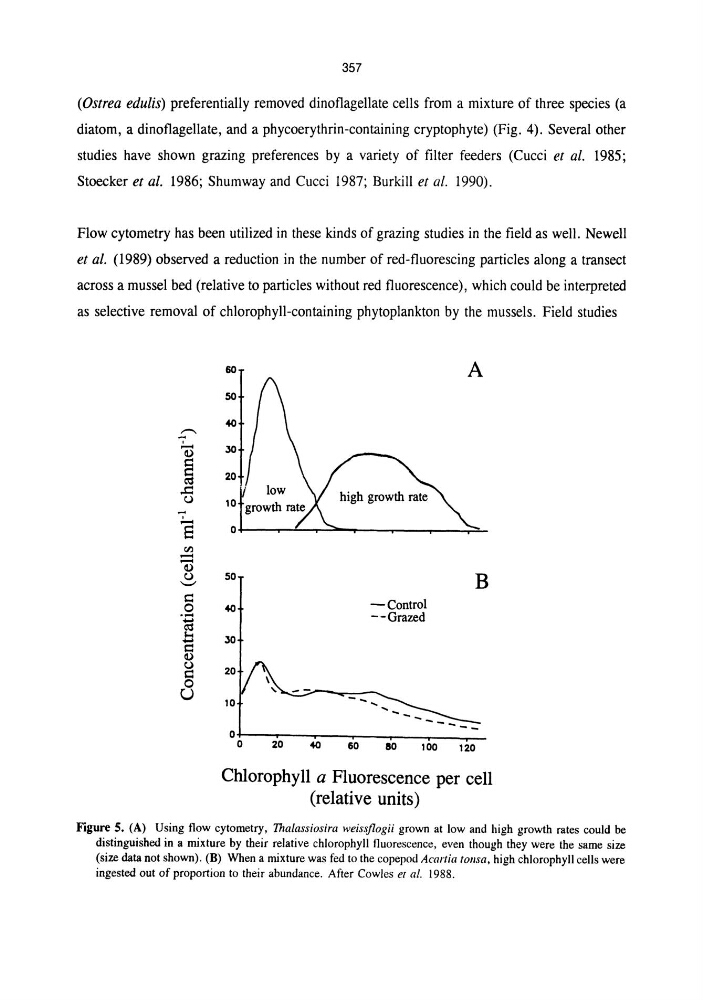
Figure s. (A) Using flow cytometry, Thalassiosira weissjlogii grown at low and high growth rates could be
distinguished in a mixture by their relative chlorophyll fluorescence, even though they were the same size
(size data not shown). (B) When a mixture was fed to the copepod Acania tOllsa, high chlorophyll cells were
ingested out of proportion to their abundance. After Cowles et al. 1988.
(Ostrea edulis) preferentially removed dinoflagellate cells from a mixture of three species (a
diatom, a dinoflagellate, and a phycoerythrin-containing cryptophyte) (Fig. 4). Several other
studies have shown grazing preferences by a variety of filter feeders (Cucci et al. 1985;
Stoecker et aT. 1986; Shumway and Cucci 1987; Burkill et af. 1990).
Flow cytometry has been utilized in these kinds of grazing studies in the field as well. Newell
et aT. (1989) observed a reduction in the number of red-fluorescing particles along a transect
across a mussel bed (relative to particles without red fluorescence), which could be interpreted
as selective removal of chlorophyll-containing phytoplankton by the mussels. Field studies
c
o
.~
~
§
U
60
50
B
40
-Control
--Grazed
30
10
-. ..
0t-~~--~--~--~--~--T-o
20
40
60
110
100
120
Chlorophyll a Fluorescence per cell
(relative units)
Figure s. (A) Using flow cytometry, Thalassiosira weissjlogii grown at low and high growth rates could be
distinguished in a mixture by their relative chlorophyll fluorescence, even though they were the same size
(size data not shown). (B) When a mixture was fed to the copepod Acania tOllsa, high chlorophyll cells were
ingested out of proportion to their abundance. After Cowles et al. 1988.