

8
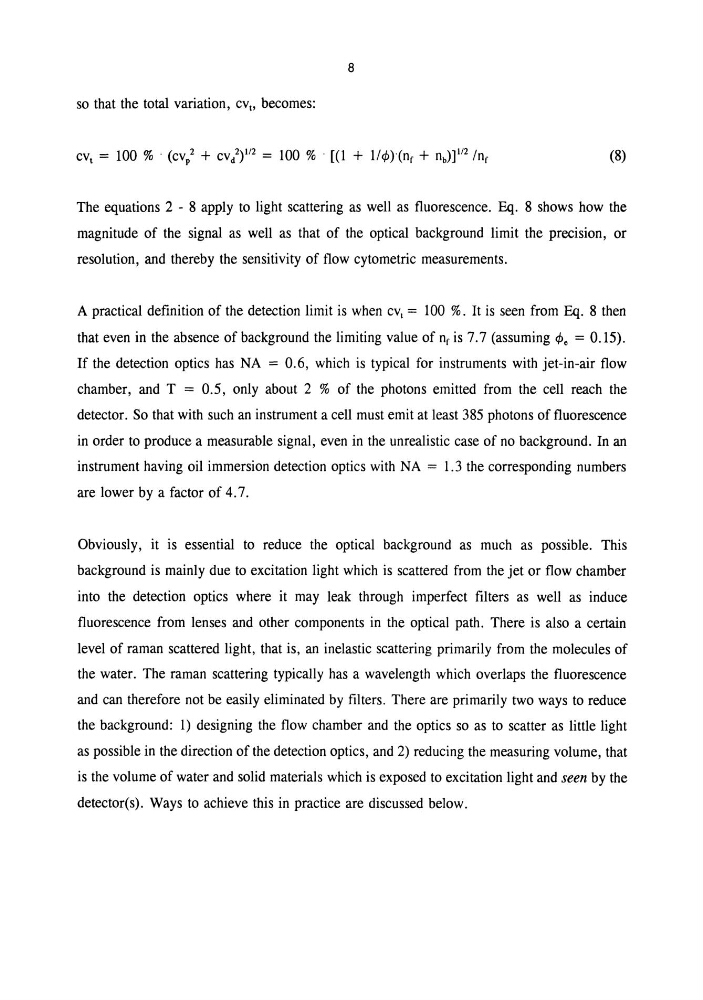
so that the total variation, cVo becomes:
(8)
The equations 2 - 8 apply to light scattering as well as fluorescence. Eq. 8 shows how the
magnitude of the signal as well as that of the optical background limit the precision, or
resolution, and thereby the sensitivity of flow cytometric measurements.
A practical definition of the detection limit is when cv1 = 100 %. It is seen from Eq. 8 then
that even in the absence of background the limiting value of nf is 7.7 (assuming 4J e = 0.15).
If the detection optics has NA = 0.6, which is typical for instruments with jet-in-air flow
chamber, and T = 0.5, only about 2 % of the photons emitted from the cell reach the
detector. So that with such an instrument a cell must emit at least 385 photons of fluorescence
in order to produce a measurable signal, even in the unrealistic case of no background. In an
instrument having oil immersion detection optics with NA = 1.3 the corresponding numbers
are lower by a factor of 4.7.
Obviously, it is essential to reduce the optical background as much as possible. This
background is mainly due to excitation light which is scattered from the jet or flow chamber
into the detection optics where it may leak through imperfect filters as well as induce
fluorescence from lenses and other components in the optical path. There is also a certain
level of raman scattered light, that is, an inelastic scattering primarily from the molecules of
the water. The raman scattering typically has a wavelength which overlaps the fluorescence
and can therefore not be easily eliminated by filters. There are primarily two ways to reduce
the background: 1) designing the flow chamber and the optics so as to scatter as little light
as possible in the direction of the detection optics, and 2) reducing the measuring volume, that
is the volume of water and solid materials which is exposed to excitation light and seen by the
detector(s). Ways to achieve this in practice are discussed below.
so that the total variation, cVo becomes:
(8)
The equations 2 - 8 apply to light scattering as well as fluorescence. Eq. 8 shows how the
magnitude of the signal as well as that of the optical background limit the precision, or
resolution, and thereby the sensitivity of flow cytometric measurements.
A practical definition of the detection limit is when cv1 = 100 %. It is seen from Eq. 8 then
that even in the absence of background the limiting value of nf is 7.7 (assuming 4J e = 0.15).
If the detection optics has NA = 0.6, which is typical for instruments with jet-in-air flow
chamber, and T = 0.5, only about 2 % of the photons emitted from the cell reach the
detector. So that with such an instrument a cell must emit at least 385 photons of fluorescence
in order to produce a measurable signal, even in the unrealistic case of no background. In an
instrument having oil immersion detection optics with NA = 1.3 the corresponding numbers
are lower by a factor of 4.7.
Obviously, it is essential to reduce the optical background as much as possible. This
background is mainly due to excitation light which is scattered from the jet or flow chamber
into the detection optics where it may leak through imperfect filters as well as induce
fluorescence from lenses and other components in the optical path. There is also a certain
level of raman scattered light, that is, an inelastic scattering primarily from the molecules of
the water. The raman scattering typically has a wavelength which overlaps the fluorescence
and can therefore not be easily eliminated by filters. There are primarily two ways to reduce
the background: 1) designing the flow chamber and the optics so as to scatter as little light
as possible in the direction of the detection optics, and 2) reducing the measuring volume, that
is the volume of water and solid materials which is exposed to excitation light and seen by the
detector(s). Ways to achieve this in practice are discussed below.