

179
maxima, nor by the present misknowledge of the size distribution in the domain of the very
small sizes. The validity of this conclusion could only be questioned if the continuous decrease
of the number of particles with increasing size was itself questioned.
Agreement between empirical and analytical approaches
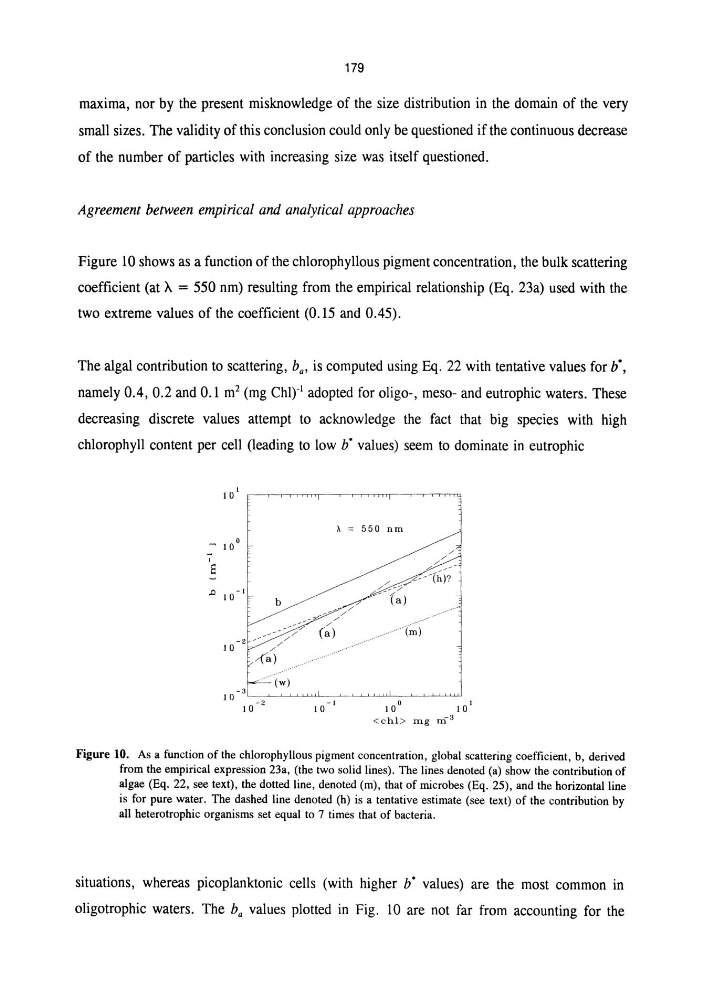
Figure 10 shows as a function of the chlorophyllous pigment concentration, the bulk scattering
coefficient (at A = 550 nm) resulting from the empirical relationship (Eq. 23a) used with the
two extreme values of the coefficient (0.15 and 0.45).
The algal contribution to scattering, b., is computed using Eq. 22 with tentative values for bO,
namely 0.4, 0.2 and 0.1 m 2 (mg Chlyl adopted for oligo-, meso- and eutrophic waters. These
decreasing discrete values attempt to acknowledge the fact that big species with high
chlorophyll content per cell (leading to low bO values) seem to dominate in eutrophic
I S
..0
-I
10
b
A = 550 nrn
.--",,-" / /
/
/
(a)
-I
10
__ -------r;;:;i
.--""'--10
10
rug m 3
1
Figure 10. As a function of the chlorophyllous pigment concentration, global scattering coefficient, b, derived
from the empirical expression 23a, (the two solid lines). The lines denoted (a) show the contribution of
algae (Eq. 22, see text), the dotted line, denoted (m), that of microbes (Eq. 25), and the horizontal line
is for pure water. The dashed line denoted (h) is a tentative estimate (see text) of the contribution by
all heterotrophic organisms set equal to 7 times that of bacteria.
situations, whereas picoplanktonic cells (with higher bO values) are the most common in
oligotrophic waters. The b. values plotted in Fig. 10 are not far from accounting for the
maxima, nor by the present misknowledge of the size distribution in the domain of the very
small sizes. The validity of this conclusion could only be questioned if the continuous decrease
of the number of particles with increasing size was itself questioned.
Agreement between empirical and analytical approaches
Figure 10 shows as a function of the chlorophyllous pigment concentration, the bulk scattering
coefficient (at A = 550 nm) resulting from the empirical relationship (Eq. 23a) used with the
two extreme values of the coefficient (0.15 and 0.45).
The algal contribution to scattering, b., is computed using Eq. 22 with tentative values for bO,
namely 0.4, 0.2 and 0.1 m 2 (mg Chlyl adopted for oligo-, meso- and eutrophic waters. These
decreasing discrete values attempt to acknowledge the fact that big species with high
chlorophyll content per cell (leading to low bO values) seem to dominate in eutrophic
I S
..0
-I
10
b
A = 550 nrn
.--",,-" / /
/
/
(a)
-I
10
__ -------r;;:;i
.--""'--10
10
1
Figure 10. As a function of the chlorophyllous pigment concentration, global scattering coefficient, b, derived
from the empirical expression 23a, (the two solid lines). The lines denoted (a) show the contribution of
algae (Eq. 22, see text), the dotted line, denoted (m), that of microbes (Eq. 25), and the horizontal line
is for pure water. The dashed line denoted (h) is a tentative estimate (see text) of the contribution by
all heterotrophic organisms set equal to 7 times that of bacteria.
situations, whereas picoplanktonic cells (with higher bO values) are the most common in
oligotrophic waters. The b. values plotted in Fig. 10 are not far from accounting for the