

178
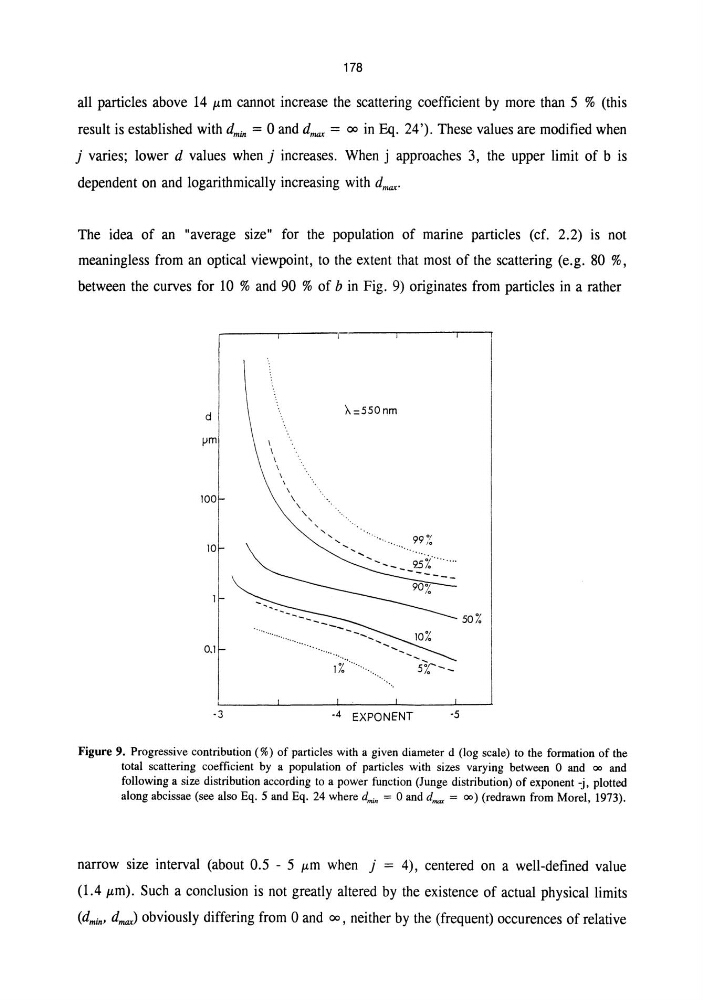
all particles above 14 Jlm cannot increase the scattering coefficient by more than 5 % (this
result is established with d min = 0 and d max = 00 in Eq. 24'). These values are modified when
j varies; lower d values when j increases. When j approaches 3, the upper limit of b is
dependent on and logarithmically increasing with d max •
The idea of an "average size" for the population of marine particles (cf. 2.2) is not
meaningless from an optical viewpoint, to the extent that most of the scattering (e.g. 80 %,
between the curves for 10 % and 90 % of b in Fig. 9) originates from particles in a rather
r------,--------"-------,-------r---r
d
jJm
100
10
0.1
·3
\
\
\
\
\
\
,
\. ,
50%
-- -- -'1%
-'5%---_
·4 EXPONENT
·5
Figure 9. Progressive contribution (%) of particles with a given diameter d (log scale) to the formation of the
total scattering coefficient by a population of particles with sizes varying between 0 and 00 and
following a size distribution according to a power function (Junge distribution) of exponent -j, plotted
along abcissae (see also Eq. 5 and Eq. 24 where dmin = 0 and d max = 00) (redrawn from Morel, 1973).
narrow size interval (about 0.5 - 5 Jlm when j = 4), centered on a well-defined value
(1.4 Jlm). Such a conclusion is not greatly altered by the existence of actual physical limits
(dmin, dmax) obviously differing from 0 and 00, neither by the (frequent) occurences of relative
all particles above 14 Jlm cannot increase the scattering coefficient by more than 5 % (this
result is established with d min = 0 and d max = 00 in Eq. 24'). These values are modified when
j varies; lower d values when j increases. When j approaches 3, the upper limit of b is
dependent on and logarithmically increasing with d max •
The idea of an "average size" for the population of marine particles (cf. 2.2) is not
meaningless from an optical viewpoint, to the extent that most of the scattering (e.g. 80 %,
between the curves for 10 % and 90 % of b in Fig. 9) originates from particles in a rather
r------,--------"-------,-------r---r
d
jJm
100
10
0.1
·3
\
\
\
\
\
\
,
\. ,
50%
-- -- -'1%
-'5%---_
·4 EXPONENT
·5
Figure 9. Progressive contribution (%) of particles with a given diameter d (log scale) to the formation of the
total scattering coefficient by a population of particles with sizes varying between 0 and 00 and
following a size distribution according to a power function (Junge distribution) of exponent -j, plotted
along abcissae (see also Eq. 5 and Eq. 24 where dmin = 0 and d max = 00) (redrawn from Morel, 1973).
narrow size interval (about 0.5 - 5 Jlm when j = 4), centered on a well-defined value
(1.4 Jlm). Such a conclusion is not greatly altered by the existence of actual physical limits
(dmin, dmax) obviously differing from 0 and 00, neither by the (frequent) occurences of relative