

154
3.5
3.0
2.5
.D 2.0
a
1.5
1.0
.5
0.0 0
5
10
15
p
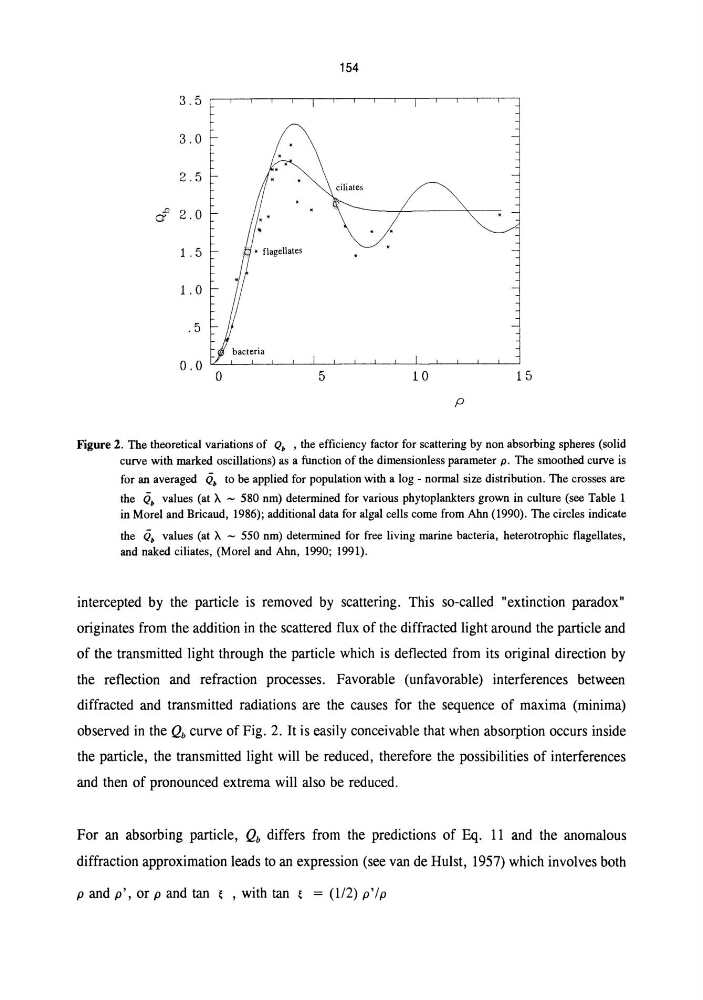
Figure 2. The theoretical variations of Q) , the efficiency factor for scattering by non absorbing spheres (solid
curve with marked oscillations) as a function of the dimensionless parameter p. The smoothed curve is
for an averaged 0) to be applied for population with a log - normal size distribution. The crosses are
the 0) values (at A - 580 run) determined for various phytoplankters grown in culture (see Table 1
in Morel and Bricaud, 1986); additional data for algal cells come from Ahn (1990). The circles indicate
the 0) values (at A - 550 nm) determined for free living marine bacteria, heterotrophic flagellates,
and naked ciliates, (Morel and Ahn, 1990; 1991).
intercepted by the particle is removed by scattering. This so-called "extinction paradox"
originates from the addition in the scattered flux of the diffracted light around the particle and
of the transmitted light through the particle which is deflected from its original direction by
the reflection and refraction processes. Favorable (unfavorable) interferences between
diffracted and transmitted radiations are the causes for the sequence of maxima (minima)
observed in the Qb curve of Fig. 2. It is easily conceivable that when absorption occurs inside
the particle, the transmitted light will be reduced, therefore the possibilities of interferences
and then of pronounced extrema will also be reduced.
For an absorbing particle, Qb differs from the predictions of Eq. 11 and the anomalous
diffraction approximation leads to an expression (see van de Hulst, 1957) which involves both
p and p', or p and tan ~ ,with tan ~ = (1/2) p'lp
3.5
3.0
2.5
.D 2.0
a
1.5
1.0
.5
0.0 0
5
10
15
p
Figure 2. The theoretical variations of Q) , the efficiency factor for scattering by non absorbing spheres (solid
curve with marked oscillations) as a function of the dimensionless parameter p. The smoothed curve is
for an averaged 0) to be applied for population with a log - normal size distribution. The crosses are
the 0) values (at A - 580 run) determined for various phytoplankters grown in culture (see Table 1
in Morel and Bricaud, 1986); additional data for algal cells come from Ahn (1990). The circles indicate
the 0) values (at A - 550 nm) determined for free living marine bacteria, heterotrophic flagellates,
and naked ciliates, (Morel and Ahn, 1990; 1991).
intercepted by the particle is removed by scattering. This so-called "extinction paradox"
originates from the addition in the scattered flux of the diffracted light around the particle and
of the transmitted light through the particle which is deflected from its original direction by
the reflection and refraction processes. Favorable (unfavorable) interferences between
diffracted and transmitted radiations are the causes for the sequence of maxima (minima)
observed in the Qb curve of Fig. 2. It is easily conceivable that when absorption occurs inside
the particle, the transmitted light will be reduced, therefore the possibilities of interferences
and then of pronounced extrema will also be reduced.
For an absorbing particle, Qb differs from the predictions of Eq. 11 and the anomalous
diffraction approximation leads to an expression (see van de Hulst, 1957) which involves both
p and p', or p and tan ~ ,with tan ~ = (1/2) p'lp