

23. BACKSCATTERING OF LIGHT BY SNOW
225
The beam diameter at the distance of 40 meters was limited to 1.5 meters,
and the divergence of the beam was about 2°. The measurements were
accomplished with an aperture that was slightly larger than the support for
snow. Extra care was taken not to include the front edge of the sample in the
aperture.
We measured either pure snow or snow with fine-grained boron carbide
as impurity. The reflectivity of pure snow was between about 0.5 and 0.7
and, for the dirtiest snow, it dropped to 0.05-0.10. The crystals of snowgrains
were from few tens of microns to few hundreds of microns in diameter
(Figure 4). In this campaign we used mostly fresh new snow.
Campaigns II and III were carried out in 1995-1997 at the Metsähovi
Observatory, Kirkkonummi, Finland. The light source was the same as in
campaign I. The only difference was the use of a halogen lamp instead of a
filament in order to guarantee a more homogeneous illumination of the
surface. The baseline during the new measurements was 70 meters. Thus, we
were able to measure the snow down to the minimum phase angle of 0.16
degrees. We measured older snow with grains larger than those in campaign
I. As impurity we used silicon carbide powder with 25-50 micron particle
size. The final reflectivities were higher than in campaign I.
3.
MEASUREMENTS AND RESULTS
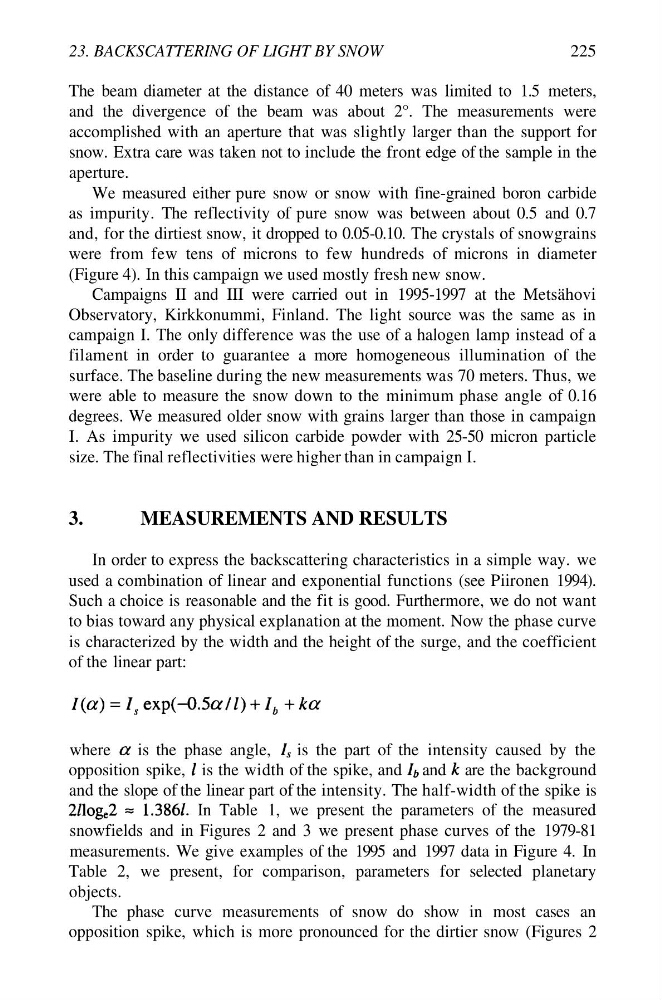
In order to express the backscattering characteristics in a simple way. we
used a combination of linear and exponential functions (see Piironen 1994).
Such a choice is reasonable and the fit is good. Furthermore, we do not want
to bias toward any physical explanation at the moment. Now the phase curve
is characterized by the width and the height of the surge, and the coefficient
of the linear part:
where
is the phase angle,
is the part of the intensity caused by the
opposition spike, is the width of the spike, and and are the background
and the slope of the linear part of the intensity. The half-width of the spike is
In Table 1, we present the parameters of the measured
snowfields and in Figures 2 and 3 we present phase curves of the 1979-81
measurements. We give examples of the 1995 and 1997 data in Figure 4. In
Table 2, we present, for comparison, parameters for selected planetary
objects.
The phase curve measurements of snow do show in most cases an
opposition spike, which is more pronounced for the dirtier snow (Figures 2
225
The beam diameter at the distance of 40 meters was limited to 1.5 meters,
and the divergence of the beam was about 2°. The measurements were
accomplished with an aperture that was slightly larger than the support for
snow. Extra care was taken not to include the front edge of the sample in the
aperture.
We measured either pure snow or snow with fine-grained boron carbide
as impurity. The reflectivity of pure snow was between about 0.5 and 0.7
and, for the dirtiest snow, it dropped to 0.05-0.10. The crystals of snowgrains
were from few tens of microns to few hundreds of microns in diameter
(Figure 4). In this campaign we used mostly fresh new snow.
Campaigns II and III were carried out in 1995-1997 at the Metsähovi
Observatory, Kirkkonummi, Finland. The light source was the same as in
campaign I. The only difference was the use of a halogen lamp instead of a
filament in order to guarantee a more homogeneous illumination of the
surface. The baseline during the new measurements was 70 meters. Thus, we
were able to measure the snow down to the minimum phase angle of 0.16
degrees. We measured older snow with grains larger than those in campaign
I. As impurity we used silicon carbide powder with 25-50 micron particle
size. The final reflectivities were higher than in campaign I.
3.
MEASUREMENTS AND RESULTS
In order to express the backscattering characteristics in a simple way. we
used a combination of linear and exponential functions (see Piironen 1994).
Such a choice is reasonable and the fit is good. Furthermore, we do not want
to bias toward any physical explanation at the moment. Now the phase curve
is characterized by the width and the height of the surge, and the coefficient
of the linear part:
where
is the phase angle,
is the part of the intensity caused by the
opposition spike, is the width of the spike, and and are the background
and the slope of the linear part of the intensity. The half-width of the spike is
In Table 1, we present the parameters of the measured
snowfields and in Figures 2 and 3 we present phase curves of the 1979-81
measurements. We give examples of the 1995 and 1997 data in Figure 4. In
Table 2, we present, for comparison, parameters for selected planetary
objects.
The phase curve measurements of snow do show in most cases an
opposition spike, which is more pronounced for the dirtier snow (Figures 2