

148
Chapter 16
constraining nature of multiple acquisitions on the model inversion,
however.
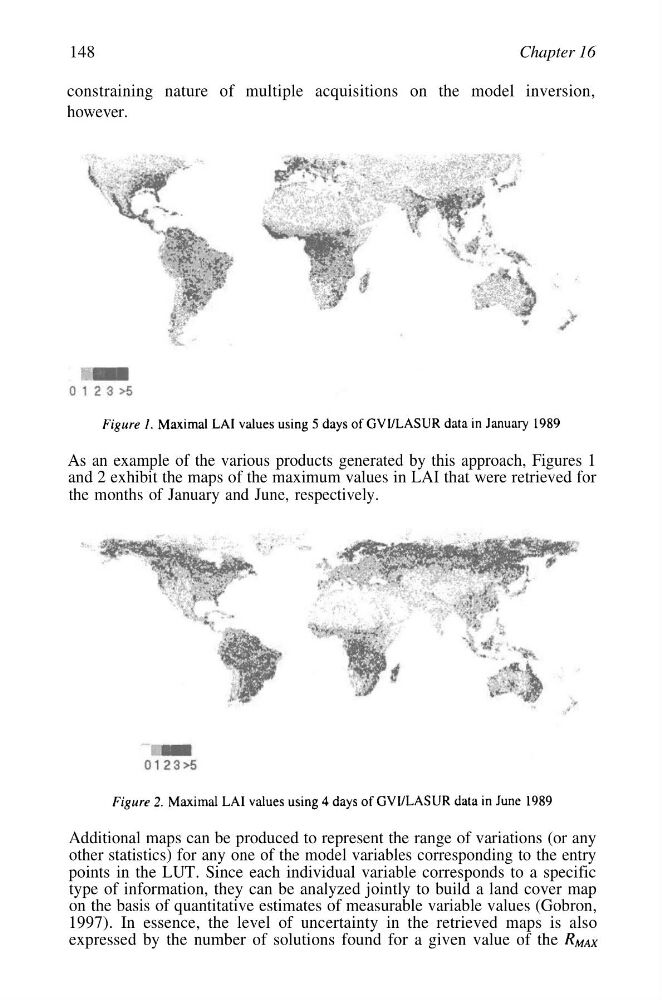
As an example of the various products generated by this approach, Figures 1
and 2 exhibit the maps of the maximum values in LAI that were retrieved for
the months of January and June, respectively.
Additional maps can be produced to represent the range of variations (or any
other statistics) for any one of the model variables corresponding to the entry
points in the LUT. Since each individual variable corresponds to a specific
type of information, they can be analyzed jointly to build a land cover map
on the basis of quantitative estimates of measurable variable values (Gobron,
1997). In essence, the level of uncertainty in the retrieved maps is also
expressed by the number of solutions found for a given value of the
Chapter 16
constraining nature of multiple acquisitions on the model inversion,
however.
As an example of the various products generated by this approach, Figures 1
and 2 exhibit the maps of the maximum values in LAI that were retrieved for
the months of January and June, respectively.
Additional maps can be produced to represent the range of variations (or any
other statistics) for any one of the model variables corresponding to the entry
points in the LUT. Since each individual variable corresponds to a specific
type of information, they can be analyzed jointly to build a land cover map
on the basis of quantitative estimates of measurable variable values (Gobron,
1997). In essence, the level of uncertainty in the retrieved maps is also
expressed by the number of solutions found for a given value of the