

Overview of Image Processing
61
a
b
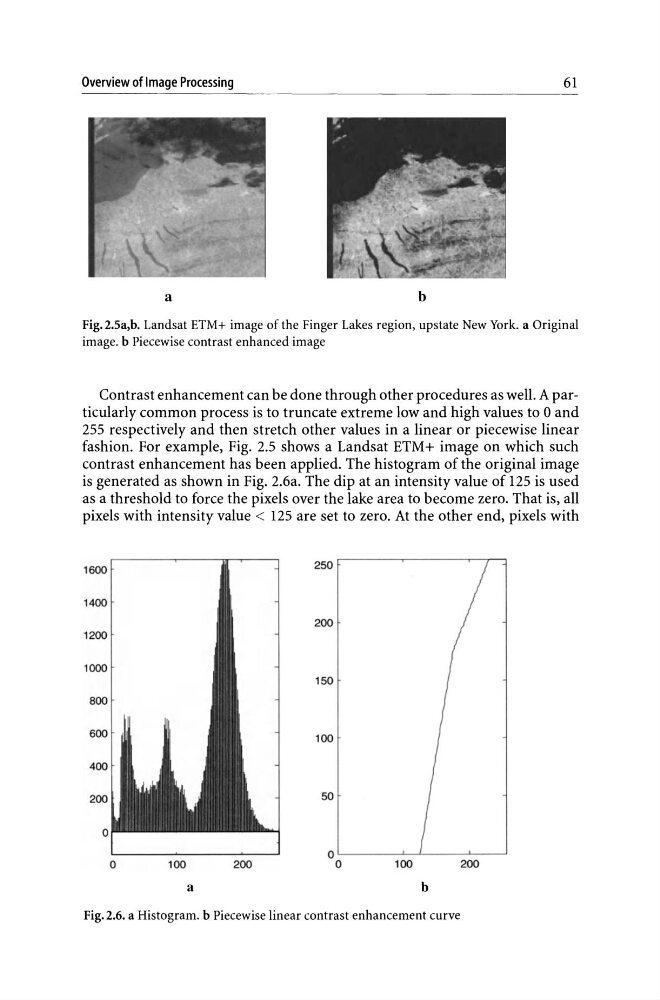
Fig.2.5a,b. Landsat ETM + image of the Finger Lakes region, upstate New York. a Original
image. b Piecewise contrast enhanced image
Contrast enhancement can be done through other procedures as well. A particularly common process is to truncate extreme low and high values to 0 and
255 respectively and then stretch other values in a linear or piecewise linear
fashion. For example, Fig. 2.5 shows a Landsat ETM+ image on which such
contrast enhancement has been applied. The histogram of the original image
is generated as shown in Fig. 2.6a. The dip at an intensity value of 125 is used
as a threshold to force the pixels over the lake area to become zero. That is, all
pixels with intensity value < 125 are set to zero. At the other end, pixels with
250
200
150
100
50
O L-------~L-----~--~
o
100
200
o
100
200
a
b
Fig. 2.6. a Histogram. b Piecewise linear contrast enhancement curve
61
a
b
Fig.2.5a,b. Landsat ETM + image of the Finger Lakes region, upstate New York. a Original
image. b Piecewise contrast enhanced image
Contrast enhancement can be done through other procedures as well. A particularly common process is to truncate extreme low and high values to 0 and
255 respectively and then stretch other values in a linear or piecewise linear
fashion. For example, Fig. 2.5 shows a Landsat ETM+ image on which such
contrast enhancement has been applied. The histogram of the original image
is generated as shown in Fig. 2.6a. The dip at an intensity value of 125 is used
as a threshold to force the pixels over the lake area to become zero. That is, all
pixels with intensity value < 125 are set to zero. At the other end, pixels with
250
200
150
100
50
O L-------~L-----~--~
o
100
200
o
100
200
a
b
Fig. 2.6. a Histogram. b Piecewise linear contrast enhancement curve