

Image Change Detection and Fusion Using MRF Models
301
a
b
c
d
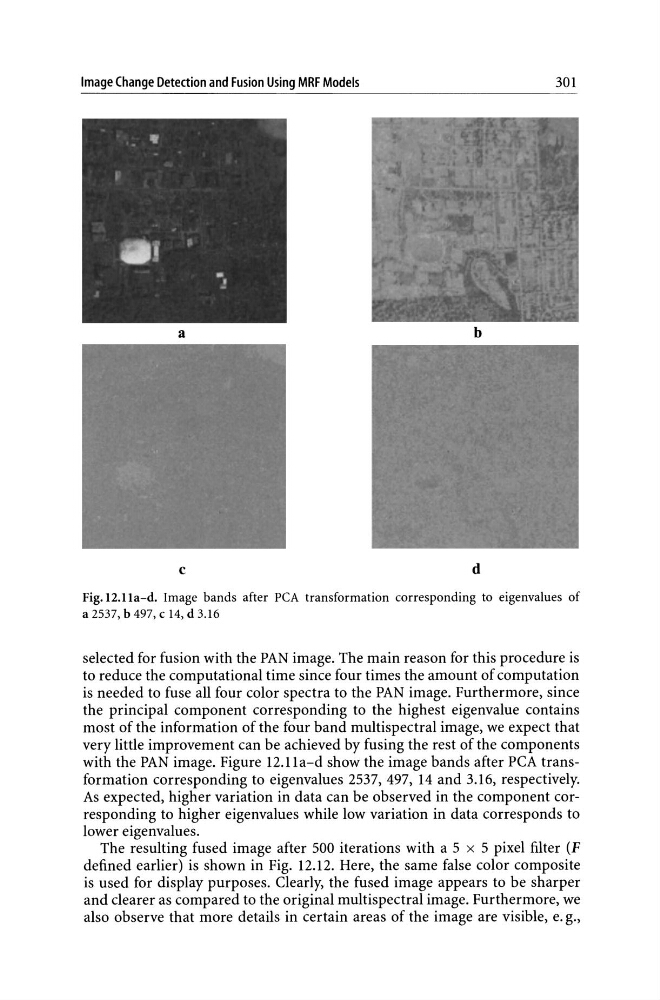
Fig.12.11a-d. Image bands after PCA transformation corresponding to eigenvalues of
a 2537, b 497, c 14, d 3.16
selected for fusion with the PAN image. The main reason for this procedure is
to reduce the computational time since four times the amount of computation
is needed to fuse all four color spectra to the PAN image. Furthermore, since
the principal component corresponding to the highest eigenvalue contains
most of the information of the four band multispectral image, we expect that
very little improvement can be achieved by fusing the rest of the components
with the PAN image. Figure 12.11a-d show the image bands after peA transformation corresponding to eigenvalues 2537, 497, 14 and 3.16, respectively.
As expected, higher variation in data can be observed in the component corresponding to higher eigenvalues while low variation in data corresponds to
lower eigenvalues.
The resulting fused image after 500 iterations with a 5 x 5 pixel filter (F
defined earlier) is shown in Fig. 12.12. Here, the same false color composite
is used for display purposes. Clearly, the fused image appears to be sharper
and clearer as compared to the original multispectral image. Furthermore, we
also observe that more details in certain areas of the image are visible, e. g.,
301
a
b
c
d
Fig.12.11a-d. Image bands after PCA transformation corresponding to eigenvalues of
a 2537, b 497, c 14, d 3.16
selected for fusion with the PAN image. The main reason for this procedure is
to reduce the computational time since four times the amount of computation
is needed to fuse all four color spectra to the PAN image. Furthermore, since
the principal component corresponding to the highest eigenvalue contains
most of the information of the four band multispectral image, we expect that
very little improvement can be achieved by fusing the rest of the components
with the PAN image. Figure 12.11a-d show the image bands after peA transformation corresponding to eigenvalues 2537, 497, 14 and 3.16, respectively.
As expected, higher variation in data can be observed in the component corresponding to higher eigenvalues while low variation in data corresponds to
lower eigenvalues.
The resulting fused image after 500 iterations with a 5 x 5 pixel filter (F
defined earlier) is shown in Fig. 12.12. Here, the same false color composite
is used for display purposes. Clearly, the fused image appears to be sharper
and clearer as compared to the original multispectral image. Furthermore, we
also observe that more details in certain areas of the image are visible, e. g.,