

226
9: Chintan A. Shah
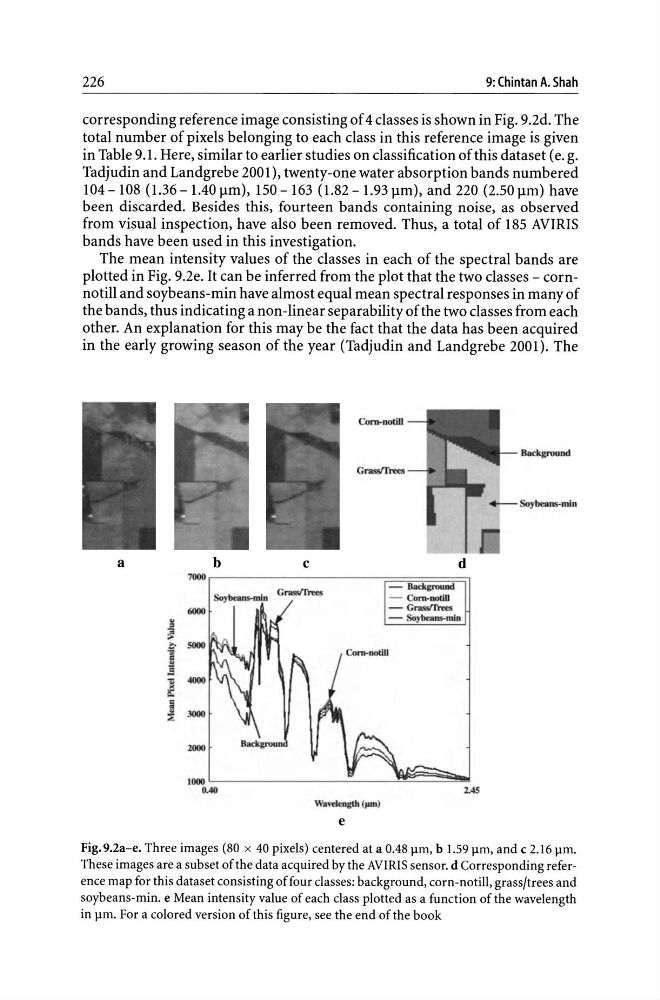
corresponding reference image consisting of 4 classes is shown in Fig. 9.2d. The
total number of pixels belonging to each class in this reference image is given
in Table 9.1. Here, similar to earlier studies on classification of this dataset (e. g.
Tadjudin and Landgrebe 2001), twenty-one water absorption bands numbered
104 - 108 (1.36 - 1.40 llm), 150 - 163 (1.82 - 1.93llm), and 220 (2.50 llm) have
been discarded. Besides this, fourteen bands containing noise, as observed
from visual inspection, have also been removed. Thus, a total of 185 AVIRIS
bands have been used in this investigation.
The mean intensity values of the classes in each of the spectral bands are
plotted in Fig. 9.2e. It can be inferred from the plot that the two classes - cornnotill and soybeans-min have almost equal mean spectral responses in many of
the bands, thus indicating a non -linear separability of the two classes from each
other. An explanation for this may be the fact that the data has been acquired
in the early growing season of the year (Tadjudin and Landgrebe 2001). The
a
Com·ootiD
b
c
d
7000 ,--------------------r==~==~~
-
Bacl.ground
Soybea.ns-miD Gras
6000
-
Gras
Soybea.ns-min
2000
JOOO ~----------~~--~~~~
0.40
2.45
Wa.'dength (JuD)
e
Fig.9.2a-e. Three images (80 x 40 pixels) centered at a 0.48 \lm, b 1.59 \lm, and c 2.16 \lm.
These images are a subset of the data acquired by the AVIRIS sensor. d Corresponding reference map for this dataset consisting of four classes: background, corn-notill, grass/trees and
soybeans-min. e Mean intensity value of each class plotted as a function of the wavelength
in \lm. For a colored version of this figure, see the end of the book
9: Chintan A. Shah
corresponding reference image consisting of 4 classes is shown in Fig. 9.2d. The
total number of pixels belonging to each class in this reference image is given
in Table 9.1. Here, similar to earlier studies on classification of this dataset (e. g.
Tadjudin and Landgrebe 2001), twenty-one water absorption bands numbered
104 - 108 (1.36 - 1.40 llm), 150 - 163 (1.82 - 1.93llm), and 220 (2.50 llm) have
been discarded. Besides this, fourteen bands containing noise, as observed
from visual inspection, have also been removed. Thus, a total of 185 AVIRIS
bands have been used in this investigation.
The mean intensity values of the classes in each of the spectral bands are
plotted in Fig. 9.2e. It can be inferred from the plot that the two classes - cornnotill and soybeans-min have almost equal mean spectral responses in many of
the bands, thus indicating a non -linear separability of the two classes from each
other. An explanation for this may be the fact that the data has been acquired
in the early growing season of the year (Tadjudin and Landgrebe 2001). The
a
Com·ootiD
b
c
d
7000 ,--------------------r==~==~~
-
Bacl.ground
Soybea.ns-miD Gras
6000
-
Gras
Soybea.ns-min
2000
JOOO ~----------~~--~~~~
0.40
2.45
Wa.'dength (JuD)
e
Fig.9.2a-e. Three images (80 x 40 pixels) centered at a 0.48 \lm, b 1.59 \lm, and c 2.16 \lm.
These images are a subset of the data acquired by the AVIRIS sensor. d Corresponding reference map for this dataset consisting of four classes: background, corn-notill, grass/trees and
soybeans-min. e Mean intensity value of each class plotted as a function of the wavelength
in \lm. For a colored version of this figure, see the end of the book