

214
8: Stefan A. Robila, Pramod K. Varshney
0.09 , - - - - - - - - - - - - - - - - - - - - - - ,
0.08
0.07
PCA
0.06
0.05
0.04
ICA
0.03
0.02
UICA
0.01
OL-_L-_L-_~_~_~_~_~_~_~_~
o
10
15
20
25
30
35
40
45
50
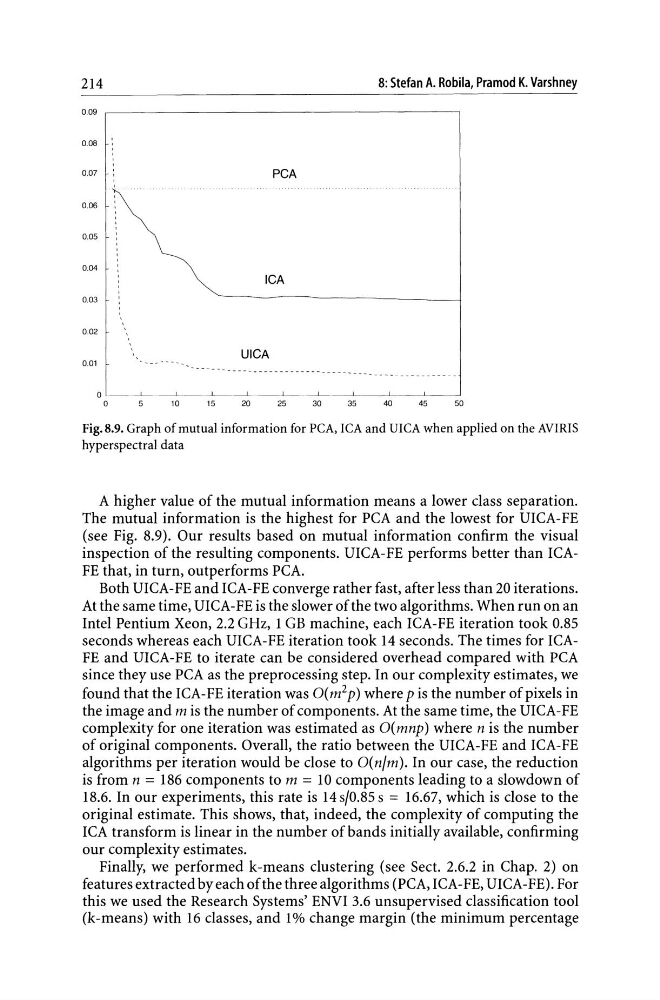
Fig. 8.9. Graph of mutual information for peA, leA and meA when applied on the AVIRIS
hyperspectral data
A higher value of the mutual information means a lower class separation.
The mutual information is the highest for PCA and the lowest for UICA-FE
(see Fig. 8.9). Our results based on mutual information confirm the visual
inspection of the resulting components. UICA-FE performs better than ICAFE that, in turn, outperforms PCA.
Both UICA-FE and ICA-FE converge rather fast, after less than 20 iterations.
At the same time, UICA-FE is the slower of the two algorithms. When run on an
Intel Pentium Xeon, 2.2 GHz, 1 GB machine, each ICA-FE iteration took 0.85
seconds whereas each UICA-FE iteration took 14 seconds. The times for ICAFE and UICA-FE to iterate can be considered overhead compared with PCA
since they use PCA as the preprocessing step. In our complexity estimates, we
found that the ICA-FE iteration was O(m2p) where p is the number of pixels in
the image and m is the number of components. At the same time, the UICA-FE
complexity for one iteration was estimated as O(mnp) where n is the number
of original components. Overall, the ratio between the UICA-FE and ICA-FE
algorithms per iteration would be close to O(n/m). In our case, the reduction
is from n = 186 components to m = 10 components leading to a slowdown of
18.6. In our experiments, this rate is 14 s/0.85 s = 16.67, which is close to the
original estimate. This shows, that, indeed, the complexity of computing the
ICA transform is linear in the number of bands initially available, confirming
our complexity estimates.
Finally, we performed k-means clustering (see Sect. 2.6.2 in Chap. 2) on
features extracted by each of the three algorithms (PCA, ICA-FE, UICA-FE). For
this we used the Research Systems' ENVI 3.6 unsupervised classification tool
(k-means) with 16 classes, and 1% change margin (the minimum percentage
8: Stefan A. Robila, Pramod K. Varshney
0.09 , - - - - - - - - - - - - - - - - - - - - - - ,
0.08
0.07
PCA
0.06
0.05
0.04
ICA
0.03
0.02
UICA
0.01
OL-_L-_L-_~_~_~_~_~_~_~_~
o
10
15
20
25
30
35
40
45
50
Fig. 8.9. Graph of mutual information for peA, leA and meA when applied on the AVIRIS
hyperspectral data
A higher value of the mutual information means a lower class separation.
The mutual information is the highest for PCA and the lowest for UICA-FE
(see Fig. 8.9). Our results based on mutual information confirm the visual
inspection of the resulting components. UICA-FE performs better than ICAFE that, in turn, outperforms PCA.
Both UICA-FE and ICA-FE converge rather fast, after less than 20 iterations.
At the same time, UICA-FE is the slower of the two algorithms. When run on an
Intel Pentium Xeon, 2.2 GHz, 1 GB machine, each ICA-FE iteration took 0.85
seconds whereas each UICA-FE iteration took 14 seconds. The times for ICAFE and UICA-FE to iterate can be considered overhead compared with PCA
since they use PCA as the preprocessing step. In our complexity estimates, we
found that the ICA-FE iteration was O(m2p) where p is the number of pixels in
the image and m is the number of components. At the same time, the UICA-FE
complexity for one iteration was estimated as O(mnp) where n is the number
of original components. Overall, the ratio between the UICA-FE and ICA-FE
algorithms per iteration would be close to O(n/m). In our case, the reduction
is from n = 186 components to m = 10 components leading to a slowdown of
18.6. In our experiments, this rate is 14 s/0.85 s = 16.67, which is close to the
original estimate. This shows, that, indeed, the complexity of computing the
ICA transform is linear in the number of bands initially available, confirming
our complexity estimates.
Finally, we performed k-means clustering (see Sect. 2.6.2 in Chap. 2) on
features extracted by each of the three algorithms (PCA, ICA-FE, UICA-FE). For
this we used the Research Systems' ENVI 3.6 unsupervised classification tool
(k-means) with 16 classes, and 1% change margin (the minimum percentage